Exclusive: Are you happy that 30% of all taxes you pay go on people’s benefits?
Finally, the mind-boggling UK debt and spending numbers - made real
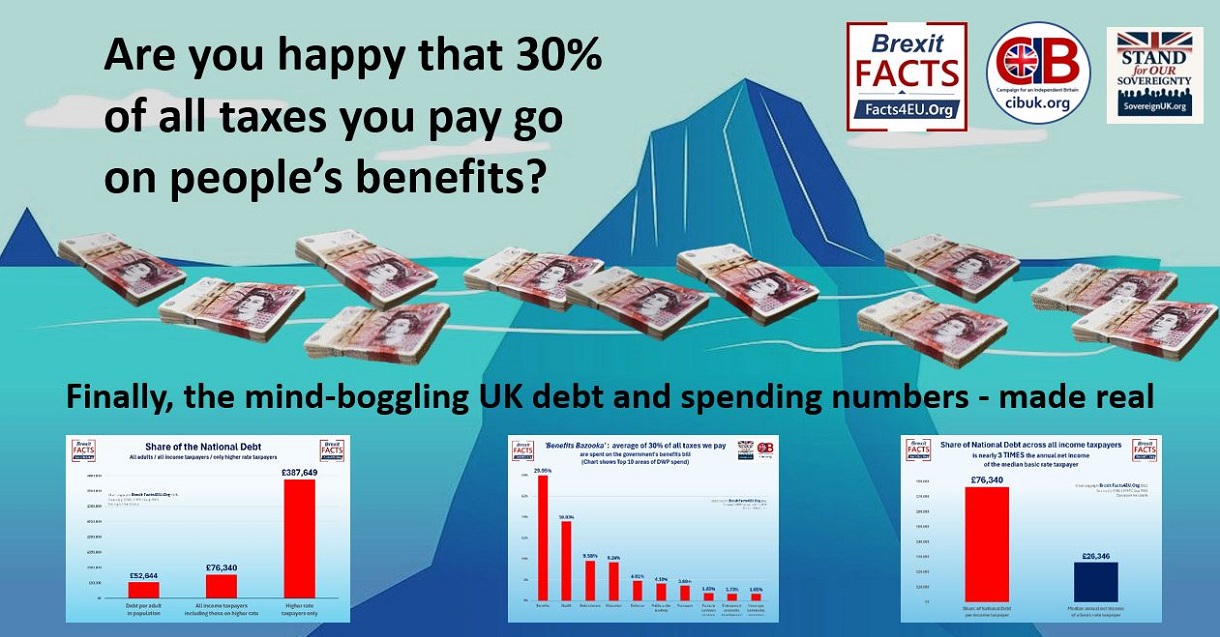
Montage © Facts4EU.Org 2026
Facts4EU reveals how your money is spent and how the UK’s £3 trillion debt hits YOU in your pocket
Every UK adult now owes over £50,000 as his or her share of this massive burden
To whom do you owe most? Your mortgage provider? Credit card company? Or your government’s creditors? And how much of the tax you pay is going to people on benefits of various kinds?
A special Facts4EU report in collaboration with Stand for Our Sovereignty (SOS) and The Campaign for an Independent Britain (CIBUK) and produced exclusively for GB News exposes just how much it's costing you personally each year to pay for
- our government's annual expenditure
- the enormous benefits bill
- covering debt interest to bond markets
and for how much you notionally now ‘owe’ to the government’s creditors for your share of the total national debt it has racked up.
On Friday (21 Aug), the Office for National Statistics released its latest government debt figures, covering what we need to borrow to stay afloat. It also released the latest public spending figures, so we know where your tax pounds are going.
Mind-boggling numbers – made real
Against market expectations, the UK sailed perilously close to a major high-water point – that of the THREE TRILLION POUND National Debt – but came in very marginally under. The amount of our indebtedness as a country is now so large that the numbers are meaningless to most of us. As ever, the ONS announced the latest official total in its usual bland way.
“Public sector net debt – the amount owed to the UK private sector and overseas, less liquid assets - was provisionally estimated at £2,984.9 billion at the end of July 2026, £95.9 billion more than a year earlier.”
- ONS, Fri 21 Aug 2026
Burnham bust?
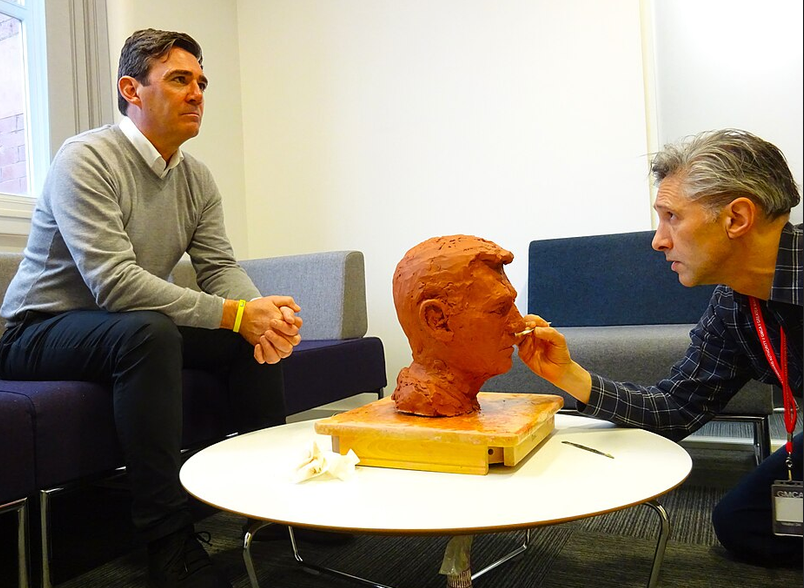
This number is so close to three trillion pounds as to be considered as a given amongst all commentators. With next month's figures ‘the King of the North’ will almost inevitably reign over an economy with that official designation.
This report puts this gargantuan amount of debt into very personal, real terms, for each and every one of us.
Photo left: The Mayor of Manchester was officially immortalised in clay last year... [Licence: Creative Commons CC0 1.0, Padgett]
Lord (John) Redwood, former Secretary of State
commented exclusively to GB News and Facts4EU
“I have more government than I want, more government than I need, and more government than I can afford.”
“The government is running up huge debts which taxpayers will have to pay. You probably have a big enough mortgage and credit card bill without having to shoulder the state's borrowing as well. If you have repaid the mortgage and have some savings in retirement, the last thing you want is your savings raided to bail out a spendthrift, wasteful government.
“Each of us adults, on average, is now £52,000 more in debt thanks to runaway government spending. It will mean many more tax rises to come.

“As the state debt surges through £3,000,000,000,000, an unimaginably large sum, it means more taxes now to pay all the interest on the debt, and more taxes to come when we have to repay all that money the state borrowed.
“We have got used to government living well beyond its means and borrowing the rest. When interest rates were around 1% that was not too painful. Now they are 5% and rising for 30-year loans it is becoming increasingly painful. As Facts4EU show, we could get to the point where they cannot keep spending on the never-never.”
On top of any personal debts you may have, you ‘owe’ considerably more
If you are an adult member of the population of the United Kingdom of Great Britain and Northern Ireland, your share of the national debt now stands at £52,644.
Furthermore, if the debt were notionally confined to that seemingly shrinking proportion of the population known as “the taxpayers”, then the share escalates, as seen below.
If you are one of the increasing number who have found themselves in the higher tax bracket, now around 8.5 million people, then your share is truly a sobering number.
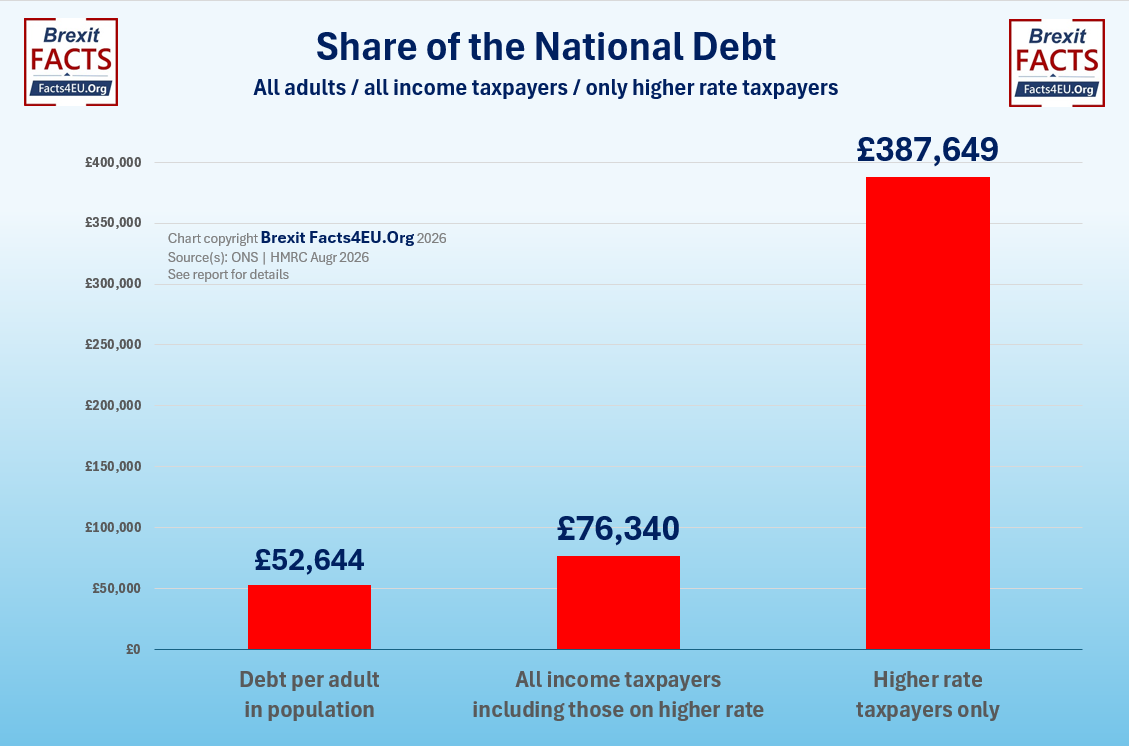
© Brexit Facts4EU.Org 2026 - click to enlarge
How long would it take to pay off your share?
According to HMRC, if you are a median basic rate taxpayer, your annual net income (after tax and N.I.) is £26,346.
HMRC’s records also show there are 39.1 million of us paying income tax, at basic rate or above. This means the share of National Debt amongst all income taxpayers is £76,340.
That’s nearly three times your net annual income if you are the median basic rate taxpayer.
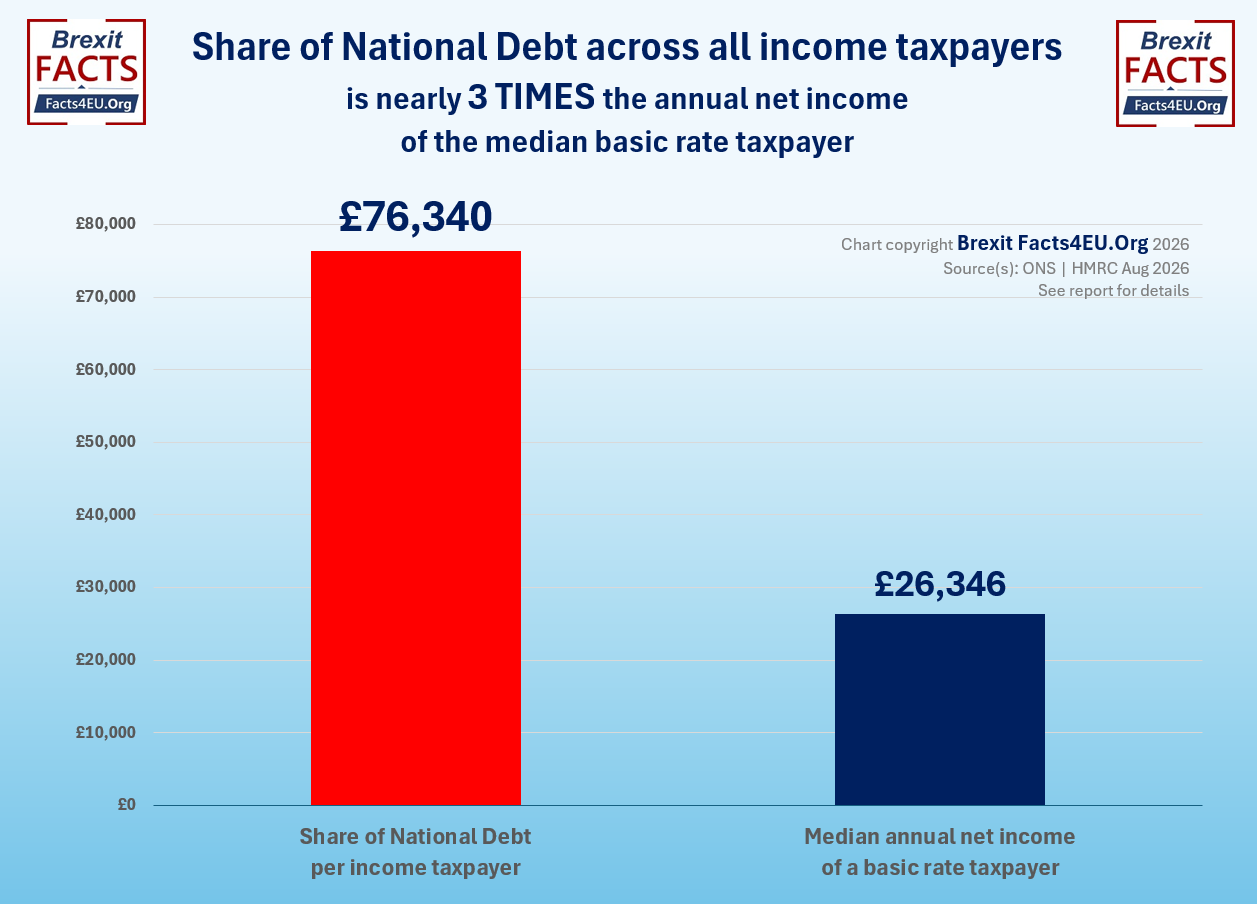
© Brexit Facts4EU.Org 2026 - click to enlarge
Today, if you wanted to pay off the government’s creditors for your share (£76,340) of its huge indebtedness, you would be highly unlikely or able to want to pay it all at once. If the government’s creditors agreed to suspend all further interest payments (they wouldn’t) and let you pay if off at the rate of, say, 5% of your net annual income each year, (they wouldn’t), it would take you 58 years to do so.
BEFORE WE CONTINUE...
To be a full-time, effective voice in opposition to what's happening to our country,
it costs around £15,000 per month.
We receive far, far less than that and really need more readers to help us.
Please donate or become a member today so we can make even more of a difference.
Any credit card user
Quick One-off

From £5 - £1,000
Monthly

From £3 per month
Paypal Users Only - Choose amount first
Quick One-off
Monthly
Don't leave this to someone else. You are that 'someone else'.
State spending – Where's it all going? - The Top 10 breakdown
The government spends enormous sums every year to provide us all with the panoply of services we expect – and many we don’t want or use personally. Readers will doubtless ask themselves if they feel they are getting value.
In the last tax year (2025/6), the Dept for Work & Pensions shows the government having spent £1.4 TRILLION (£1,360.1bn). This is funded by income tax (the highest component) as well as National Insurance contributions, VAT, and a variety of other taxes such as fuel duty, capital tax, alcohol and tobacco duties, council tax, and others, and borrowing.
The truly shocking discovery from our research came from looking at where this vast amount of money is now going.
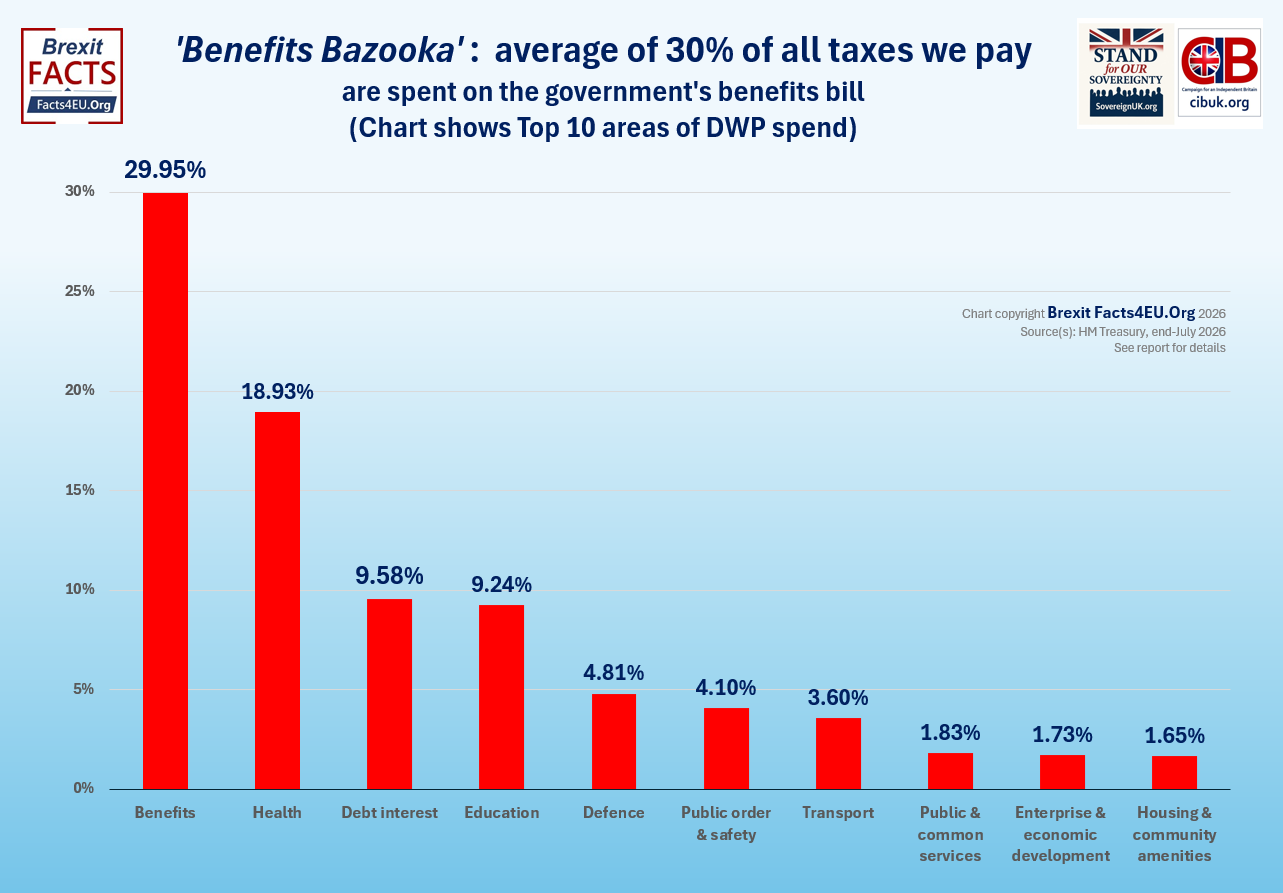
Just shy of 30% now goes on paying benefits.
[Note: Readers may see percentages of around 25% being quoted, particularly by AI, but we are using the definitions used internationally to encompass all social protection. There are many variations between the figures quoted by governnment departments. In the end we mostly used the figures from HM Treasury in the latest official public sector spending statistics book.]
Below we show the proportion of all taxes spent on the Top 10 areas of government spending.
© Brexit Facts4EU.Org 2026 - click to enlarge
'The benefits bazooka'
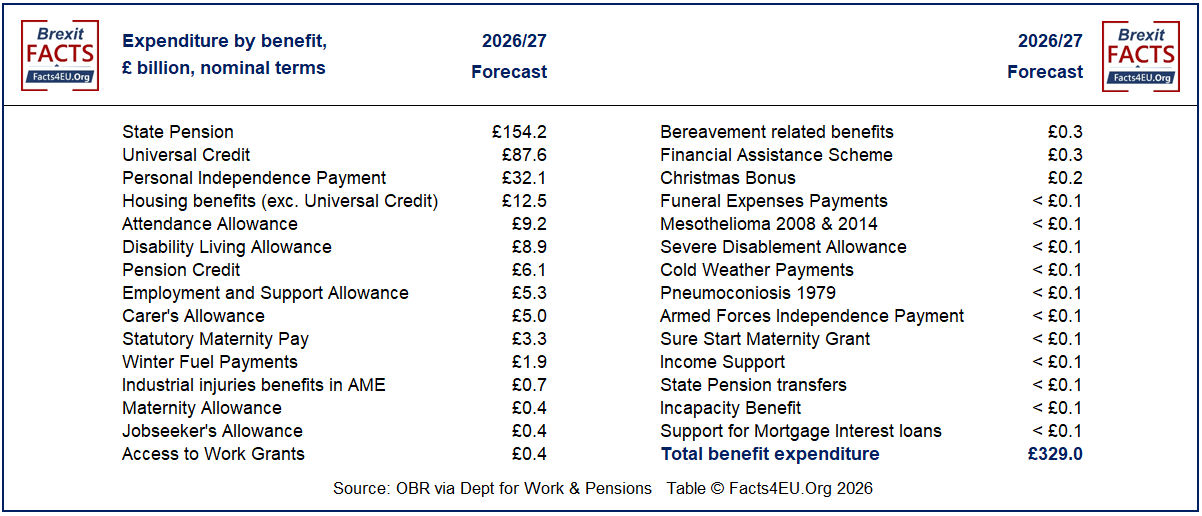
Coming in at No.1 in the spending figures we analysed is ‘benefits’ which includes the large number of areas shown below.
The 30% share of tax being taken for these purposes this year (2026/7) is nearly 60% more than the share for health, over three times education, over six times defence, and over seven times what is spent on law and order.
How the benefits bazooka' breaks down
© Brexit Facts4EU.Org 2026 - click to enlarge
Finally, money spent for nothing in return
Rising up our public spending chart to take the No.3 slot is one item no-one wants to see: the nearly 10% (9.6%) of total revenues in the last tax year funding interest payments to cover the escalating National Debt. The actual amount was £130.3 billion. This buys us nothing in terms of any services delivered and is the result of successive governments spending far beyond their means.
Rather than being honest and cutting spending on wasteful areas, or increasing taxes to pay for their increased spending - which would make them unpopular with some voters - the politicians have ‘hidden’ their profligacy by borrowing the money instead.
'Money to Burn(ham)’?
Andy Burnham shows no signs of reversing this trend – quite the opposite. Whilst other politicians have gone before him with a ‘spend, spend, spend’ attitude, in the next month the ‘King of the North’ will almost inevitably reign over an economy officially laden with over £3 TRILLION in debt.
Indeed, as the numbers lag reality it is safe to assume that this is already the case. When it comes to ‘burnhaming’ our tax pounds for nothing by paying interest on borrowing from the international bond markets, this is clearly only going one way. As interest rates rise and Mr Burnham’s spending plans escalate, we will have more to say on this after his new Chancellor’s first budget in October.
Photo right: Mr Burnham in Ukraine on Monday.

Lord Redwood, former Secretary of State
with his final, exclusive comments to GB News and Facts4EU
“How does a country go bankrupt? Slowly for a long time, then in a rush - to adapt Hemingway.
“Labour should know, as they over-borrowed in the 1970s and ended up needing an emergency IMF loan which forced them to start making cuts. The market demanded an eye-watering 15.5% interest rate to borrow.
“The massive build-up of debt under this government on top of the huge borrowings to get through Covid made by the last government with Labour support means we are much closer now to a debt crunch.
“As Facts4EU brilliantly reveals, much of the big burden of debt charges will fall to be paid by higher income tax payers who also pay most of the IHT, Stamp duties and CGT. As debt and taxes rise, more of them will leave, adding to the tax burden on everyone else. In the 1970s Labour tried an 83% top tax rate and triggered a big exodus of the rich and talented. That speeded up the bankruptcy and the collapse of the government.
“To avoid the same again this time the government needs to do one simple thing. Spend and borrow less.”
Observations
When researching and writing reports dealing with macro-economic matters and necessarily large numbers, we always look for ways to make the information as accessible as possible to the average reader who only has so much time.
After numerous iterations, we hope readers will agree this report goes a long way to meeting this goal. Naturally the methods we have employed involved averaging the effects of the various amounts we discuss across large numbers of people. Nevertheless, they bring the reader much closer to the facts in a more personal and relatable way than we have seen.
The amount of data and the number of papers we had to study was on a very large scale and this special report is up there with our most time-consuming in the past 10+ years. If you value our unique work, please do something now to help to keep us going. No matter how small, every contribution adds up. Sadly we receive only a fraction of the number we need to survive.
Please, please help us to carry on our vital work in defence of independence, sovereignty, democracy and freedom by donating today. Thank you.
[ Sources: HMRC | ONS | OBR ] Politicians and journalists can contact us for details, as ever.
Brexit Facts4EU.Org, Thurs 27 Aug 2026
Click here to go to our news headlines
Please scroll down to COMMENT on the above article.
And don't forget actually to post your message after you have previewed it!
Since before the EU Referendum, Brexit Facts4EU.Org
has been the most prolific researcher and publisher of Brexit facts in the world.
Supported by MPs, MEPs, & other groups, our work has impact.
We think facts matter. Please donate today, so that we can continue to ensure a clean Brexit is finally delivered.
Any credit card user
Quick One-off
From £5 - £1,000
Monthly
From £3 per month
Paypal Users Only - Choose amount first
Quick One-off
Monthly
Something to say about this? Scroll down for reader comments