The public sector is now spending over £1.2 TRILLION pounds of our money each year
They’ve spent nearly 6 TRILLION in 5 years - Would you like to know what they’re spending it on?
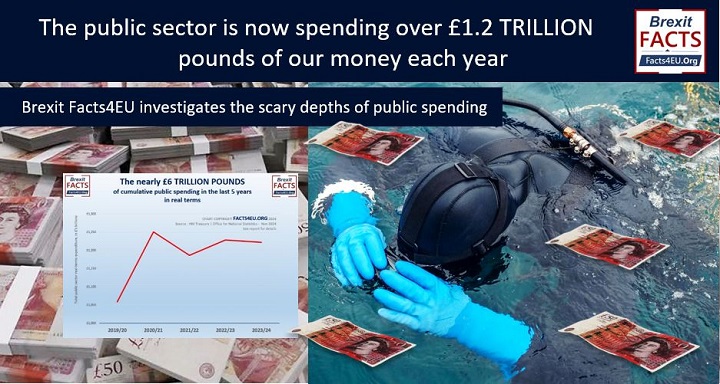
Montage © Facts4EU.Org 2024
A Facts4EU.Org summary and explainer – How the public sector is spending our money
The public sector is now spending over £1.2 TRLLION pounds per year of our money. In the last five years to March this year (2024) the public sector has spent over £5.9 TRILLION in real terms. Some of this is earned by the country through the hard work of its people and the rest of it is borrowed by our country’s Government on our behalf. The latter adds to the UK’s rapidly-expanding debt, which in turn has to be financed by higher debt interest payments.

At a time when Sir Keir Starmer and Chancellor Rachel Reeves are telling us that “difficult choices” have to be made, and when segments of our population are suffering from cuts (e.g. the elderly in the case of winter fuel allowances, and farmers in respect of inheritance taxes), the Facts4EU.Org team thought it would be interesting for readers to know what spending choices are being made in our name.

To put the figure of £1.2 trillion into context, annually the UK’s public sector now spends:-
- More than the entire GDPs of 173 countries on the World Bank’s list
- More than the entire GDPs of 23 of the 27 EU countries
- 44.5% of the UK’s entire GDP
Today we provide an overview of public spending. In follow-up reports we will delve down into some of the detail and look at areas such as ‘social protection’, which includes welfare benefits, unemployment, and also at interest payments on the UK’s spiralling debts. We will also reveal the cost of immigration and specifically the cost of policing this.
A Brexit Facts4EU.Org Series
The UK's public expenditure
Part I (This report) : The UK's public sector spends more than £1.2 trillion a year - and rising
Part II : The Top 20 fastest-rising areas of public spending
Part III : For the first time ever, the National Audit Office won't sign off the UK's accounts
Part IV : How much are we spending on migrants/welfare/unemployment/policing?
Part V : The public spending exclusively for Scotland, Wales, and Northern Ireland, plus overall summary
Brexit Facts4EU.Org Summary
Public sector expenditure in £s billions
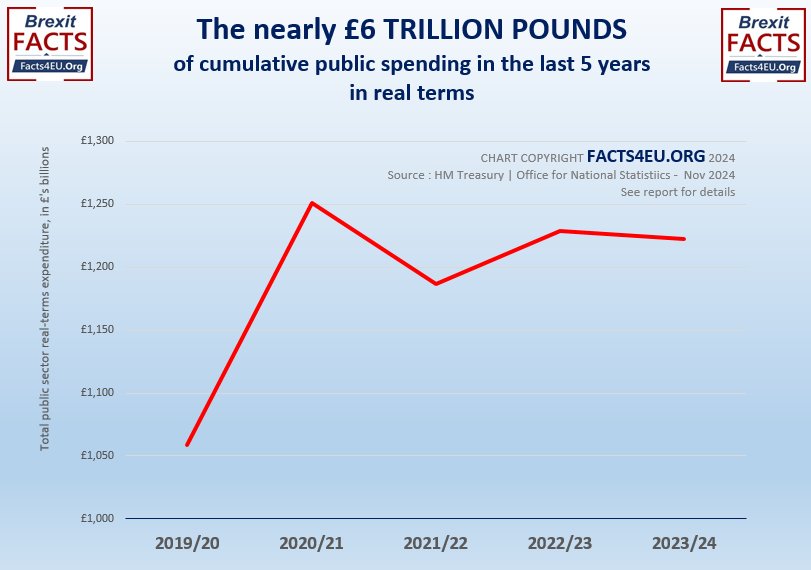
1. The 16% real terms increase in public spending in the last 5 years
Cumulative spending totals £5.9 TRILLION in that time
- 2019/20 : £1,058.5
- 2020/21 : £1,251.3
- 2021/22 : £1,186.8
- 2022/23 : £1,228.8
- 2023/24 : £1,222.7
- TOTAL : £5,948.1 billion (nearly £6 TRILLION)
[Research sources for all data : HM Treasury and ONS, End-Nov 2024. All figures are in real terms, using 2023/4 as the reference point.]
© Brexit Facts4EU.Org 2024 - click to enlarge
'COVID splurge' has been banked by the public sector - spending continues at that higher level
Our chart above clearly shows how public spending increased dramatically after the Covid pandemic started. What is much harder to explain is why this higher level of public spending now appears to have been banked by the public sector as 'the new norm'.
The Rt Hon Sir John Redwood, former Secretary of State, commented on our report
"Facts4EU are right to tell us there has been a huge surge in public spending since the Covid outbreak. No costs were spared to fight the disease, and large sums were spent on subsidising business and paying benefits to people who were prevented from working.
"This should have corrected by now. Instead the public sector spends much more for delivering less, and leaves many people of working age on benefits. Instead of putting up taxes government needs to get its spending under control and deliver value for money.”
- The Rt Hon Sir John Redwood, 10 Nov 2024
Public spending in the year ended March 2024 was 16% higher than in the year pre-Covid. The public might well have expected this to have fallen from its peak-Covid heights, but this hasn't happened.

GB News are covering this Facts4EU.Org series of special reports
We have been sharing our findings with GB News, the UK's fastest-growing news channel, to ensure the widest possible audience.
The Facts4EU.Org team is indebted to the former MEP, now a very popular GB News presenter, Martin Daubney, for his regular encouragement during our research work.
Brexit Facts4EU.Org Summary
Public sector expenditure in £s billions - Continued
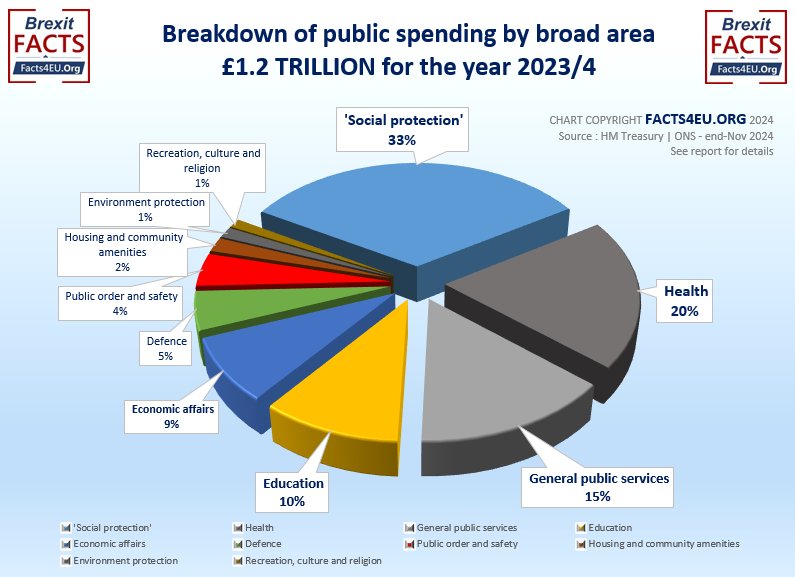
2. The 10 broad areas of public sector expenditure, in the year 2023/4, in £s billions
- 'Social protection' : £364.3
- Health : £221.3
- General public services : £161.9
- Education : £113.2
- Economic affairs : £94.2
- Defence : £56.8
- Public order and safety : £48.6
- Housing and community amenities : £21.1
- Environment protection : £15.9
- Recreation, culture and religion : £13.4
- Total public sector expenditure on services : £1,1103.3
- Accounting adjustments : £112.4
- Total public sector managed expenditure : £1,222.7 bn
© Brexit Facts4EU.Org 2024 - click to enlarge
[Research sources for all data : HM Treasury and ONS,end-Nov 2024.]
The public sector spent over £1.2 TRILLION of the country’s money in the year 2023/4
We get the messages out there but if you want us to keep doing work like this,
please support us with a small (or large!) gesture, or we will have to cut back dramatically.
Every few pounds helps to keep us fighting for Brexit,
and for independence, sovereignty, democracy and freedom.
Please help us today if you can – it takes just two minutes and your details are kept confidential.
So what is included in each of these 10 HM Treasury categories?
In this, ‘overview of public spending’, we are presenting a broad-brush picture. In subsequent parts of this series we will provide details of expenditures on various aspects of public spending, some of which will astonish readers.
For the major expenditure divisions above, as set out by HM Treasury, below are some of the items included in each area of spending. The big question for many people will be "What is 'Social Protection'?", as this formed one-third of all public spending in the year to March 2024. This represented by far the highest proportion of all public spending and we list some of what this includes below. We will return to this in future parts of this series.
- Social protection - includes sickness & disability, old age, pensions, family benefits & support, unemployment, housing, 'social exclusion'
- Health - includes medical services, research
- General public services - includes interest on public debt
- Education - includes primary, secondary, universities
- Economic affairs - includes farming and fishing, energy, transport
- Defence - includes military (plus foreign military aid) and civil defence
- Public order and safety - includes policing, fire, courts, prisons, policing immigration
- Housing and community amenities - includes water supply, social housing
- Environment protection - includes waste management, pollution, biodiversity
- Recreation, culture and religion - includes broadcasting
Observations
Every civilised society spends money on the provision of services for the collective benefit of its citizens. Most people accept that these monies go to support services which a nation must provide for everyone (e.g. defence), as well as providing services for sections of the population (e.g. those who require medical treatment or care).
Compiling this series of special reports has involved the Facts4EU.Org team in one of the deepest dives into raw government data we have ever undertaken. Readers will not be surprised by the difficulties encountered along the way. After all, £1.2 trillion is hardly a trifling sum to be attempting to analyse.
This has been made even more complicated by the fact that information is reported in different ways by different bodies. We have relied mostly on the data used by HM Treasury, as this is used in their compilation of the country's accounts. Even then this is not simple, as there are two Treasury-defined frameworks containing different presentations of two data sets. Our problems were then compunded when HM Treasury released a revised set of figures just over a week ago, on 30 November (2024), so we had to start again.
How we split the various costings
For the most part we have looked at the splits in costings by function, rather than by government department. We felt readers would be less interested in what each department spends and more interested in total public expenditure on certain activities, across all the government departments which incur costs for these. It is, however, more than likely that some costs in some departments have been grouped, making it difficult for us to be certain we have captured all costs relating to a specific activity.
Our analysis is generally consistent with the level 2 breakdown of the United Nations’ Classification Of the Functions Of Government (UN COFOG). We have also used additional Treasury-defined sub-functional divisions which do not map directly to COFOG level 2.
Coming up....
In Part II of this special Facts4EU.Org series on public expenditure, we reveal "The Top 20 fastest-rising areas of public spending". Don't miss it!
The Facts4EU.Org site and its activities such as conferences, TV & video interviews, forums, etc, are :-
- Advert-free : no annoying distractions or ‘pop-ups’
- Paywall-free : Reading our news and reports does not require you to sign up and pay
- Merchandising-free : We don’t try to sell you t-shirts or coffee mugs advertising us
- Sponsorship-free : No corporate sponsorship funds our reports – we’re independent
- We’re funded by donations from you – the public
The content :-
- Unique, original, well-researched reports
- No ‘re-hashing’ of articles you’ll read elsewhere
- Based on official data, statements and reports, analysed by us
- Transparent sources : Whether it’s the EU Commission, the ONS, or the IMF, we state where we obtained our data
- We rely solely on donations from you – the public - to keep us going
NOTICE : Facts4EU has now scaled back to publishing 5 days-a-week
For nine years we have worked seven days-a-week. As far as we are aware we are the only organisation of our type to have done this. We are grateful to those of our readers who have made donations but sadly the level of our funding is now such that we must make it stretch for as long as we can. This means team members taking other paid work and reducing our output to five days-a-week.
Please, please help us to carry on our vital work in defence of independence, sovereignty, democracy and freedom by donating today. Thank you.
[ Sources: HM Treasury | Office for National Statistics | House of Commons Library ] Politicians and journalists can contact us for details, as ever.
Brexit Facts4EU.Org, Tues 10 Dec 2024
Click here to go to our news headlines
Please scroll down to COMMENT on the above article.
And don't forget actually to post your message after you have previewed it!
Since before the EU Referendum, Brexit Facts4EU.Org
has been the most prolific researcher and publisher of Brexit facts in the world.
Supported by MPs, MEPs, & other groups, our work has impact.
We think facts matter. Please donate today, so that we can continue to ensure a clean Brexit is finally delivered.
Any credit card user
Quick One-off

From £5 - £1,000
Monthly

From £3 per month
Paypal Users Only - Choose amount first
Quick One-off
Monthly
Something to say about this? Scroll down for reader comments