Greta Thunberg will not like this report, but it’s factual
CO2 emissions, Net Zero, and the rest of the world – how does the UK compare?
Montage © Facts4EU.Org 2023
The second report in our two-parter on CO2 emissions will surprise readers
A Brexit Facts4EU two-parter on the UK versus the EU & the world on CO2 emissions
Part One : The EU pollutes far more than the UK
Part Two : Net Zero and the rest of the world – how does the UK compare? (This report)
In Part One we compared the UK’s performance on CO2 emissions with that of the EU and showed how far behind the EU really is, versus the UK. In today’s report we look out globally.
Countries such as China, the US, and India have massive populations and therefore their total emissions of CO (and other ‘greenhouse gases’) will naturally exceed those of the UK, with its much smaller population.
First we look at total emissions of CO2 by the largest countries, compared to the UK. Then we go on to show the emissions per capita, to eliminate the size of the populations.
Brexit Facts4EU.Org Summary
The UK versus the rest of the world
Total CO2 emissions in billions of tonnes, 2021
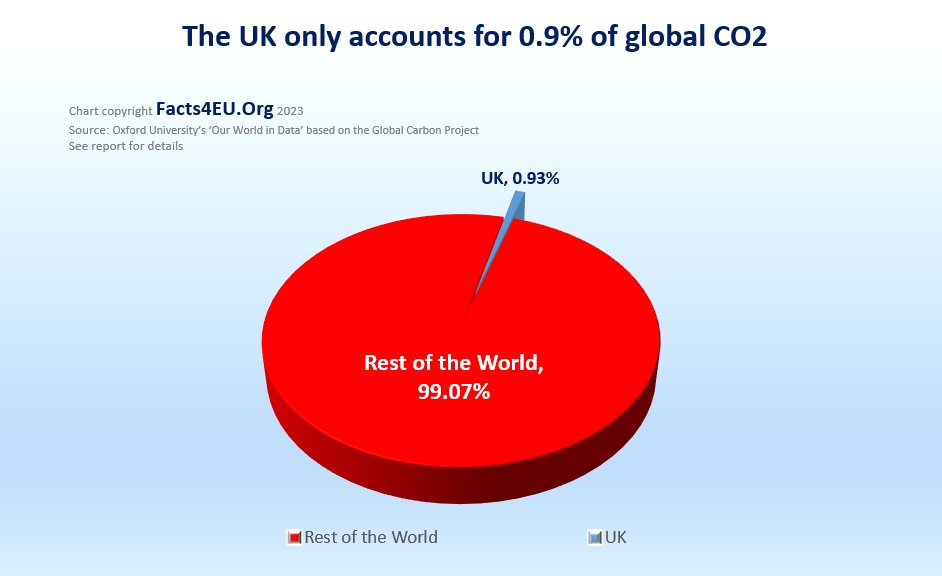
1. The global picture
- The world : 37.12bn tonnes
- The UK : 0.347bn tonnes (0.93% of global emissions of CO2)
[Source: Oxford University’s ‘Our World in Data’ based on the Global Carbon Project. Latest figures from 2021.]
© Brexit Facts4EU.Org 2023 - click to enlarge
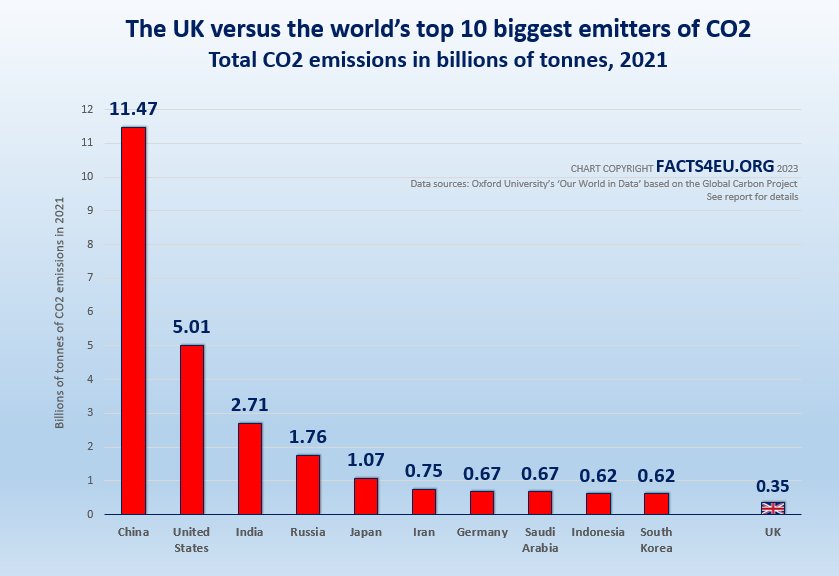
2. The UK versus the world’s top 10 biggest emitters of CO2
Total CO2 emissions in billions of tonnes, 2021
- China : 11.47
- USA : 5.01
- India : 2.71
- Russia :1.76
- Japan : 1.07
- Iran : 0.75
- Germany : 0.67
- Saudi Arabia : 0.67
- Indonesia : 0.62
- South Korea : 0.62
Other :
- EU27 : 2.79
- UK : 0.35
© Brexit Facts4EU.Org 2023 - click to enlarge
Next we look at the measure we used in Part One : CO2 emissions per capita
Using our measure of ‘CO2 emissions per person’ strips out the effect of population size. We decided to look at how the UK is performing against some of the larger countries of the world on this basis.
As we stated in Part One, we are doing this to inform the growing debate in the United Kingdom about the pace of the rush to Net Zero. The Internet’s censors reading this should note that we are making no value judgements about the extent of global warming, nor its causes. We are merely reporting facts.
CO2 emissions per capita – the major economies plus EU countries
The biggest emissions per capita by far come from the Gulf States, perhaps unsurprisingly. In order not to give readers information overload, we have focused on major economies outside that region, as well as including the EU27 countries which appear – and the results may surprise some readers.
Please treat with caution: We have taken out the Gulf states and some other smaller oil and gas producers, as well as some small island states, in order to focus on larger economies and those whose leaders parade at COP summits.
Brexit Facts4EU.Org Summary
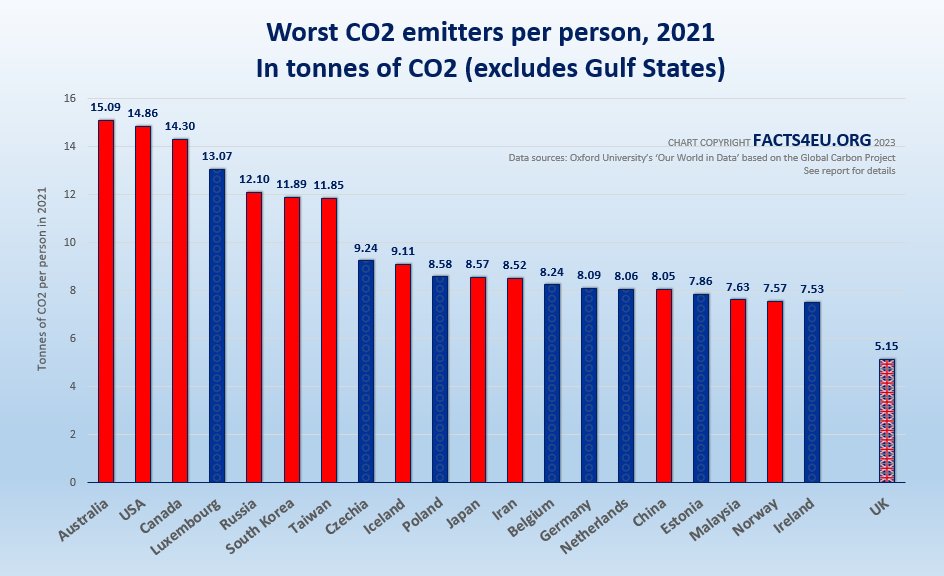
Worst CO2 emitters per person 2021 – excluding Gulf and very small or island states
- Australia : 15.09
- USA : 14.86
- Canada : 14.30
- Luxembourg (EU) : 13.07
- Russia : 12.10
- South Korea : 11.89
- Taiwan : 11.85
- Czechia (EU) : 9.24
- Iceland : 9.11
- Poland (EU) : 8.58
- Japan : 8.57
- Iran : 8.52
- Belgium (EU) : 8.24
- Germany (EU) : 8.09
- Netherlands (EU) : 8.06
- China : 8.05
- Estonia (EU) : 7.86
- Malaysia : 7.63
- Norway : 7.57
- Ireland (EU) : 7.53
- UK : 5.15
[Source: Oxford University’s ‘Our World in Data’ based on the Global Carbon Project. Latest figures from 2021.]
© Brexit Facts4EU.Org 2023 - click to enlarge

We still need to raise £6,000 for the editing of our 'The Independence Documentary'
Together with our partners at CIBUK.Org, we've organised a TV-style documentary with a stellar line-up of well-known politicians and all kinds of interesting people, young and old, men and women, white and ethnic origin, presented by Alexandra Phillips.
Alex will be known to many readers as an ex-GB News presenter and a frequent sight on everything from Question Time to Talk TV.
We have finished filming - now we have the long task of editing by our professional production team, if we can get some extra funding. This is going to be big!
Please help today if you can: click here to read more
Who would have thought the Worst 3 would be Australia, the US, and Canada?
Given the ‘luvvie, woke’ credentials of Canada’s PM, Justin Trudeau, readers may find it surprising that despite his posturing Canada comes in at No.3 in our (admittedly redacted) list. Canada is emitting nearly three times as much CO2 per person as the UK is doing.
Another point of interest is that 12 out of the Worst 25 in our list are EU member countries. It should be remembered that the EU’s No.1 policy objective is its ‘Green Deal’. Almost every pronouncement out of Brussels – on almost any subject – tries to mention the environment and how such-and-such a new policy supports the EU Commission’s Green Deal.
What of China, India, and Russia?
We are commenting on the CO2 output of these large countries because they are big emitters and because neither China nor India have condemned Putin’s illegal invasion of Ukraine. China in particular has been generally supportive of President Putin.
Taken together, these three countries represent 43% of the global emissions of CO2. Meanwhile the United Kingdom’s output accounts for just 0.93%. Not one of these three countries has engaged in anything remotely approaching the UK’s ‘Net Zero’ targets. In fact China continues to build coal-fired power stations like there’s no tomorrow.
Observations
In our two reports on CO2 emissions we have endeavoured to provide readers with useful information and to put things into a European and then a global perspective. (And to new readers we have previously also produced reports on greenhouse gases overall and many other associated topics, all of which are in our ‘Brexit Index’.)
Outside the UK, the rest of the world is responsible for 99.07% of global emissions of CO2. The vast majority of the 200+ other countries and minor states are doing virtually nothing, while the UK government has embarked on what may be the most expensive example of virtue signalling in world history.
To any internet censors reading this, we are not proposing that the UK follows China’s example and builds a new coal-fired power station every week. We simply feel that the great British public have the right to see the facts and the overall context so they can question their elected representatives about policies.
The Government has still not provided a cost-benefit analysis on its Net Zero plans. We suggest this is now urgent. We know many MPs have requested this but the Treasury is silent. We also believe that the Government should publish a clear summary of costs per type of household for each of the policies, together with the dates these will start to be incurred. Given that the government has been spending hundreds of billions of pounds of the country’s money on this, we believe it is not an unreasonable request.
Along with the immigration crisis and the cost of living crisis, any political party that fails to address these issues to the satisfaction of the electorate will doubtless feel the consequences at the next election.
We must get reports like this out there
Reports like the one above take far longer to research, write and produce than many people realise. If they were easy, readers would see other organisations also producing these daily. However, there’s little point in the Facts4EU.Org team working long hours, seven days-a-week, if we lack the resources to promote them effectively – to the public, to MPs, and to the media. This is where you come in, dear reader.
Facts4EU.Org needs you today
We are a 'not for profit' team (we make a loss) and any payment goes towards the actual work, not plush London offices, lunch or taxi expenses, or other luxuries of some organisations.
We badly need more of our thousands of readers to become members, to support this work. Could this be you, today? It's quick and easy, we give you a choice of two highly secure payment providers, and we do NOT ask you for further support if you pay once. We just hope you keep supporting us. Your membership stays anonymous unless you tell us otherwise.
Please don't assume that other people will keep us going - we don't receive enough to survive and we need your help today. Could you help us? We rely 100% on public contributions from readers like you.
If you believe in a fully-free, independent, and sovereign United Kingdom, please join now by clicking on one of the links below or you can use our Support page here. You will receive a personal, friendly ‘thank you’ from a member of our team within 24 hours. Thank you.
[ Sources: Oxford University’s ‘Our World in Data’ based on the Global Carbon Project. All figures from 2021. ] Politicians and journalists can contact us for details, as ever.
Brexit Facts4EU.Org, Thurs 17 Aug 2023
Click here to go to our news headlines
Please scroll down to COMMENT on the above article.
And don't forget to actually post your message after you have previewed it!
Since before the EU Referendum, Brexit Facts4EU.Org
has been the most prolific researcher and publisher of Brexit facts in the world.
Supported by MPs, MEPs, & other groups, our work has impact.
We think facts matter. Please donate today, so that we can continue to ensure a clean Brexit is finally delivered.
Any credit card user
Quick One-off

From £5 - £1,000
Monthly

From £3 per month
Paypal Users Only - Choose amount first
Quick One-off
Monthly
Something to say about this? Scroll down for reader comments