The EU has had decades to make its members equally rich and has failed abysmally
Latest labour report still shows average wage in poorest country nearly 1/5th of that in richest
Montage © Facts4EU.Org 2026
Plus, France comes last in wage growth and top in non-wage labour costs – lesson for Rachel?
The latest annual report from the Commission’s official statistics agency on average wages and labour costs will not have made for comfortable reading in the Commission’s headquarters in Brussels. It shows, once again, that the average wage varies dramatically across the 27 countries making up the Union.
With regard to average wages per hour, these are nearly five times higher in the top EU country, Luxembourg, as they are in the country at the bottom of the rankings, Bulgaria.
When it comes to labour costs excluding wages, e.g. social security contributions by employers, these are nearly seven times higher in the most expensive country, France, as they are in the least expensive, Romania. Perhaps this goes some way to explaining why France is at the bottom of the pile when it comes to the increase in average wages in 2025.
Welcome, for the 10th year running, to the Facts4EU
“Level Playing Field” Report on the EU
The EU has had years to ‘level up’ the wages and living standards of its peoples. Sadly, the differences between the lowest and the highest countries remains stubbornly high, both in terms of average wages per hour and average non-wage labour costs per hour.
Last week’s annual report from the EU’s statistics agency on wages and labour costs across the bloc clearly went down like a lead balloon in Ursula von der Leyen’s office in the EU Commission’s headquarters in the Berlaymont building in Brussels. Not for the first time, the Commission’s press office went strangely quiet, to the point of being struck dumb.
Once again, however, Facts4EU is able to come to the rescue, with a summary of the current position across the bloc.
In which country are you paid the most and which one the least, on average?
For the highest average wage, head for the tiny principality of Luxembourg where the hourly rate is £42.56 (€49.69 euros). Over 50% of its workforce do just that on a daily basis, commuting from one of the surrounding EU countries.
In which country are you paid the most and which one the least, on average?
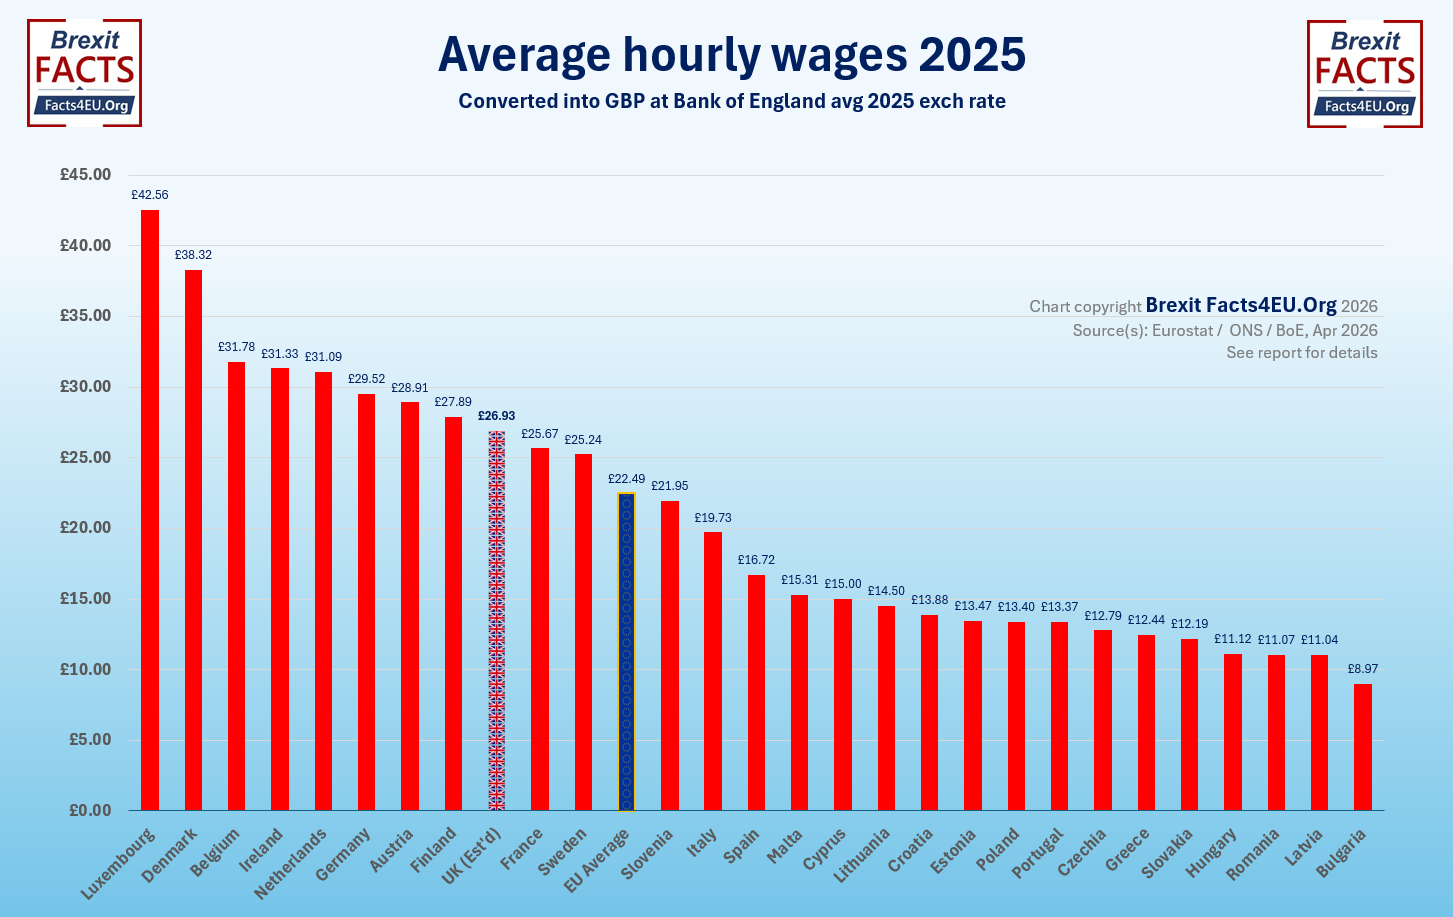
© Brexit Facts4EU.Org 2026 - click to enlarge
[Sources: Eurostat | ONS – figures accessed 07 Apr 2026. Euros converted into pounds at Bank of England average exchange rate for 2025. Note: UK figure estimated as ONS have not yet published this. Calculated using average wage growth for 2025 and applying to 2024 figure.]
Conversely, if you are looking to get rich, it might be best to strike Bulgaria from your list. There, the average wage is getting on for only 1/5th of that in Luxembourg, at £8.97 per hour (€10.47 euros).
Which country is worst for employers paying non-wage costs (social security contributions, etc)
The extra costs employers have to pay on top of wage costs is of course a major factor when deciding to employ more people. Topping this list is not an accolade when it comes to the prospects for a Chancellor looking to grow employment in a country.
Which country is worst for employers paying non-wage costs
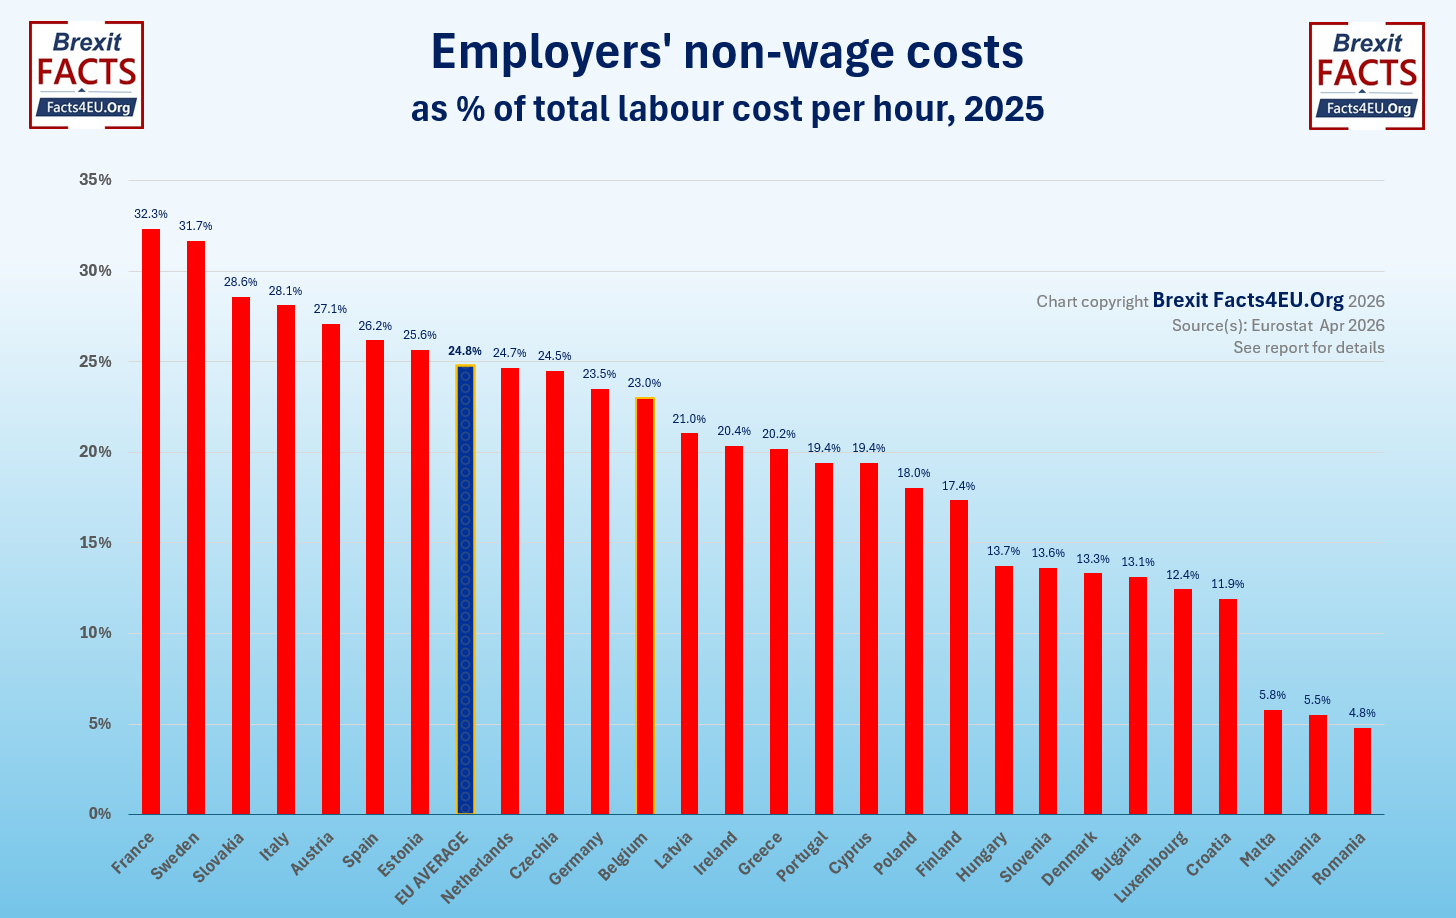
© Brexit Facts4EU.Org 2026 - click to enlarge
[Sources: Eurostat, accessed 07 Apr 2026.]
The worst country for employers is France, which is well-known for its state taking large contributions to try to fund its generous provisions for things such as healthcare.
For years we have been warning that the French economy is heading for a real bruising and this is now happening, with its deficit and debt both at high levels and increasing.
No political party with MPs, (and there are many), is keen to make the cuts which are necessary and currently there seems to be no end in sight for its embattled President, Emmanuel Macron.

Eurostat measure these costs as a percentage of the total labour costs, so this is what we have shown. In all these charts we have excluded countries where their figure is either unavailable or is under investigation for errors. In this case this excludes Belgium and Malta.
We rely wholly on patriotic members of the public to survive. Please donate today if you would like to continue reading us tomorrow, next week, and the weeks after.
Any credit card user
Quick One-off

From £5 - £1,000
Monthly

From £3 per month
Paypal Users Only - Choose amount first
Quick One-off
Monthly
Don't leave this to someone else. You are that 'someone else'.
Finally, which country saw the highest labour cost growth last year?
All of the EU’s major economies with the exception of Poland find themselves in the bottom half of the table for growth in total labour costs per hour. The clear outlier at the very bottom is France, on just 2%. As we remarked above, France has the distinction of having the highest non-wage costs, which it would be natural to assume would have a negative effect on employment and therefore wage growth.
Which country saw the highest labour cost growth last year?
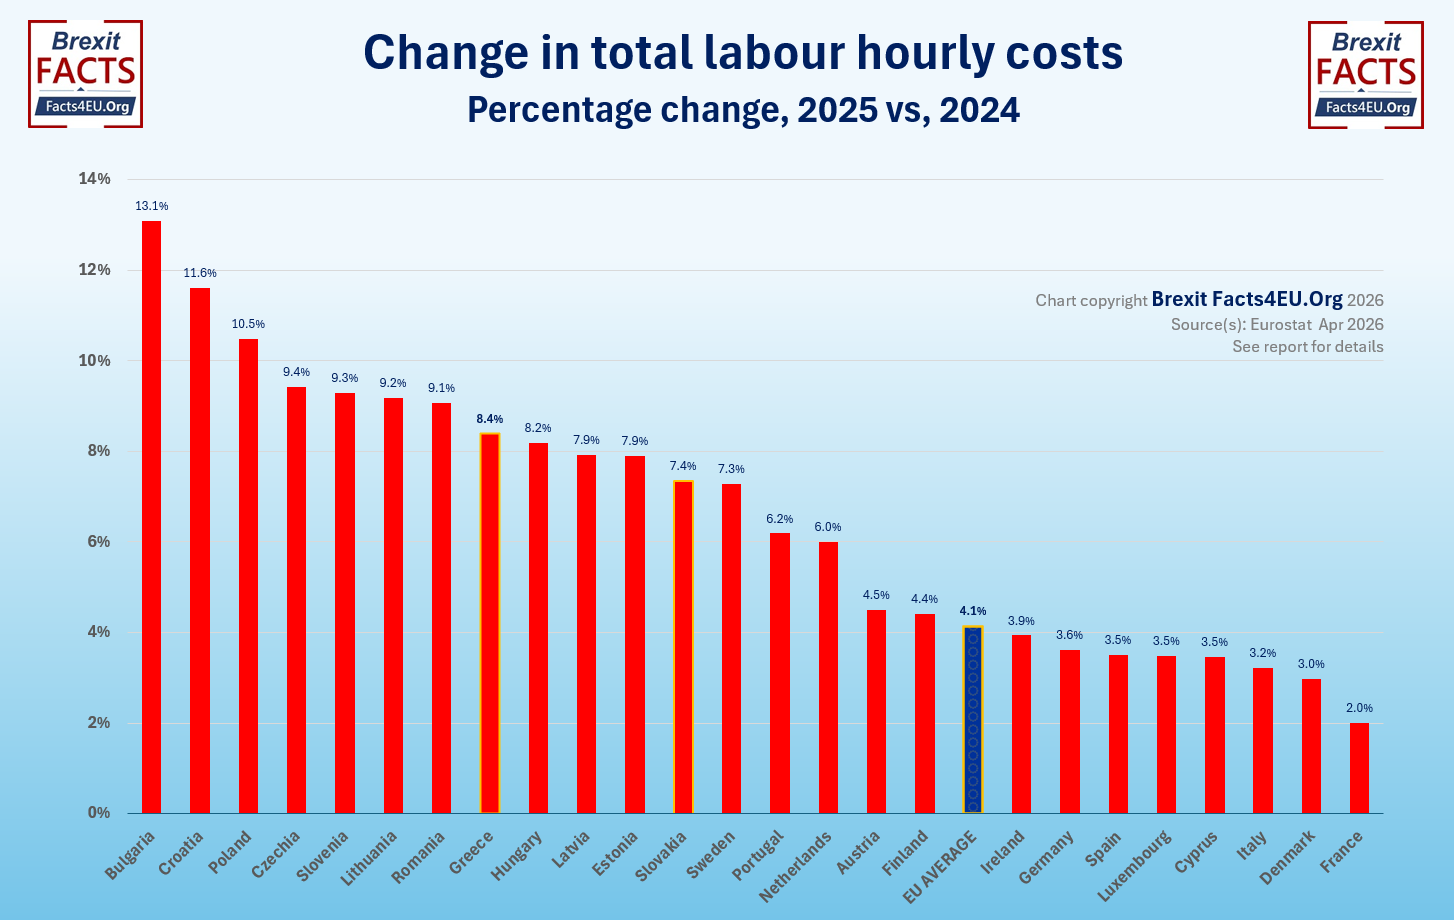
© Brexit Facts4EU.Org 2026 - click to enlarge
[Sources: Eurostat, accessed 07 Apr 2026. Note: Eurostat does not not provide this information broken down between wage and non-wage cost growth.]
Observations
Everyone is familiar with the Commission’s incessant propaganda (as the more independently-minded see it), or information (as those of a ‘Kumbaya - Let’s all join hands’ persuasion would have it). This tends to present the EU as one big ‘Level Playing Field’. The EU is, after all, a Rule-of-Law based body, with equality for all etched into every crevice of the Commission’s prestigious offices in the EU Quarter of Brussels.
It can surely only be a matter of time before there are no longer the impediments of national, elected governments to hold back the aspirations of the unelected Eurocrats who are possessed of the True Vision of One Europe led by one President.
Aside from national governments who sometimes get in the way, however, there are things called facts which can – and do – intrude, if they are allowed to. Such is the case with a body called Eurostat, the Commission’s official statistics agency. Frequently this is a very useful organisation for the Commission, which can be relied upon to churn out facts about the EU which can be spun in just the right way, with little difficulty. Problems arise, however, when the facts don’t produce anything like the right result.
Lies, damn lies, and statistics
In this case, which has been broadly similar for all of the 10 years we have looked at this, the simple facts are that the EU is just as divided on wages as it always has been. On Thursday we will be running a major report with GB News that you do NOT want to miss. It relates to Sir Keir Starmer’s ‘EU Re-Set’ and is the first in a short series we will be running, which demolish the statements the Government has made and expose a series of fundamental lies.
Today’s report has some relevance to the first report we are running on the Re-Set, as you will see. Please ensure you are ready to re-post our report – and the GB News version – as far and as widely as you can!
Please, please help us to carry on our vital work in defence of independence, sovereignty, democracy and freedom by donating today. Thank you.
[ Sources: Eurostat | EU Commission | ONS | Bank of England ] Politicians and journalists can contact us for details, as ever.
Brexit Facts4EU.Org, Tues 07 Apr 2026
Click here to go to our news headlines
Please scroll down to COMMENT on the above article.
And don't forget actually to post your message after you have previewed it!
Since before the EU Referendum, Brexit Facts4EU.Org
has been the most prolific researcher and publisher of Brexit facts in the world.
Supported by MPs, MEPs, & other groups, our work has impact.
We think facts matter. Please donate today, so that we can continue to ensure a clean Brexit is finally delivered.
Any credit card user
Quick One-off

From £5 - £1,000
Monthly

From £3 per month
Paypal Users Only - Choose amount first
Quick One-off
Monthly
Something to say about this? Scroll down for reader comments