All these taxes from Rachel Reeves - where is all the money going?
Exclusive: Facts4EU explodes the myth we all get our fair share of the money that is raised
Montage © Facts4EU.Org 2025
We break down public spending by what it is spent on and which parts of the country do best
In the long run-up to Rachel Reeves’s Budget and ever since, the topic on most people’s minds has been tax rises. The key to this is the amount of our money the government spends each year, which has to covered by tax revenues or borrowing.
In this report the Facts4EU think-tank has analysed the latest public spending figures up to the end of March 2025. In association with GB News we reveal what all these taxes – to which Rachel Reeves added an extra £20bn in her Budget - are being spent on by the state. We then go further and look at how some regions benefit a great deal more than others, from the total tax revenues raised each year.
The overview, and the breakdown of how much the government spends per region per household – for the first time
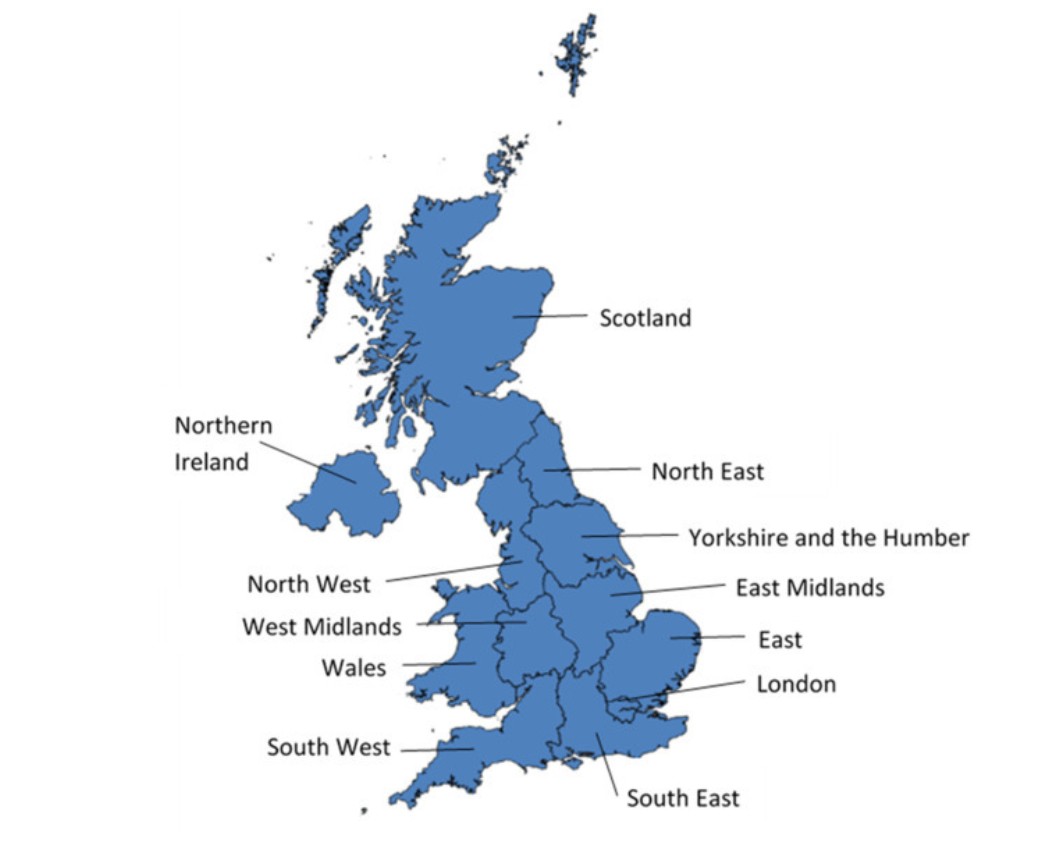
For the first time we can reveal exclusively how much public money is spent per household, for each region of the UK – and the disparities will amaze you. England is divided into its eight regions plus London, and the other three nations are shown separately.
Summary
- Overview of total spending
- What does the government spend most on?
- Where is it spent?
- Breakdown by region and nation
- England comes last
1. Overview of total spend
In the year to the end of March, public spending stood at a total of £1,288bn (nearly £1.3 trillion). £142.7bn of this was on capital expenditure (equipment, upgrades, etc).
Approximately 18% of the total was spent in the national interest and could not be identified as being spent in a particular region. The other 82% is the focus of this report, (£957 billion), as the government has been able to allocate it by where it was spent. This is public money, raised from taxes or borrowing, being spent on our behalf by the government or its agencies, in our region or nation. So how is the government spending this?
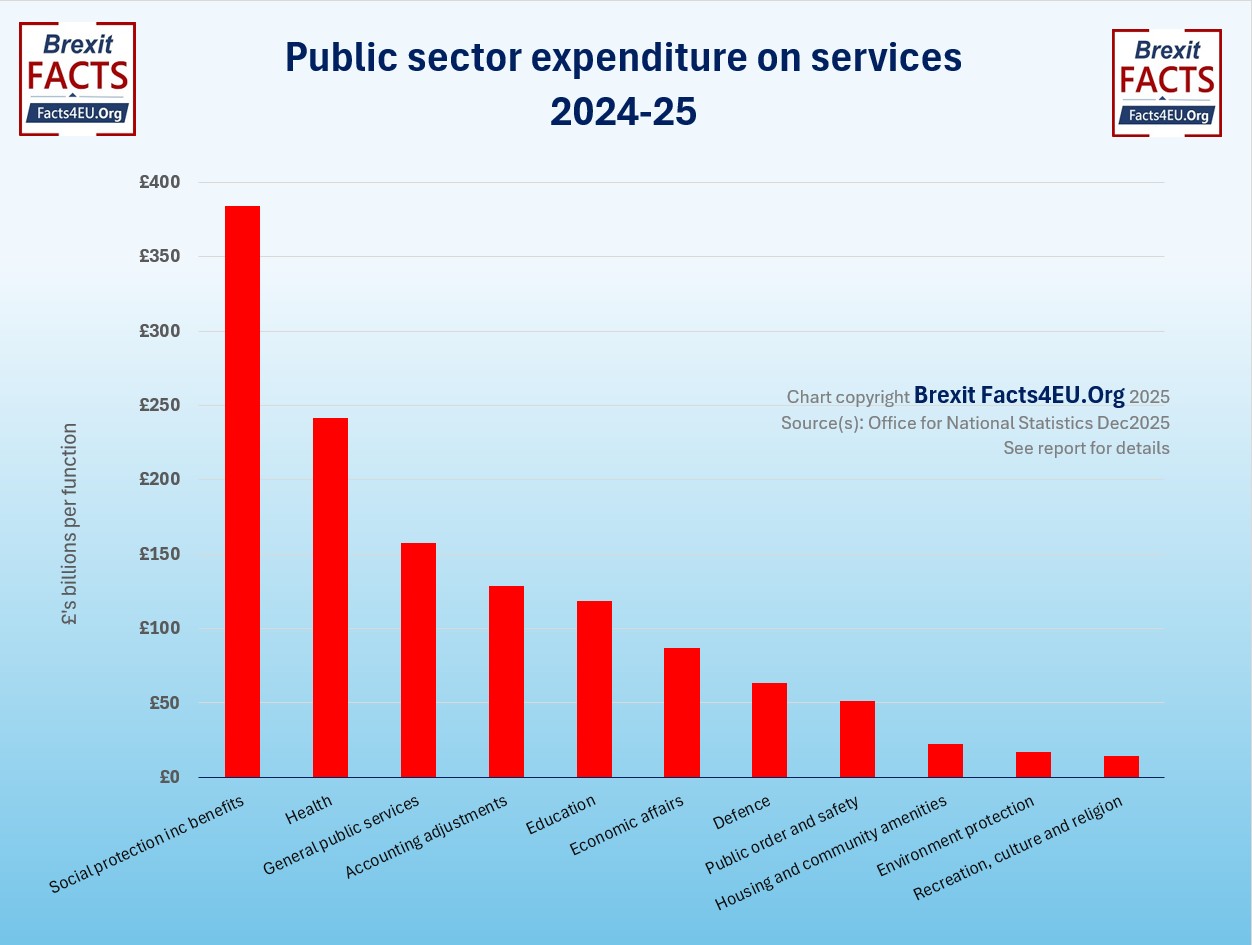
2. What does the government spend this £957 billion on?
Below is the split of how the government is spending our money. This includes all locally-identifiable expenditure – everyday spending and capital investment – wherever it takes place across the UK.
By far the largest item is ‘social protection’, which includes benefit payments. The government is now spending 59% more on this area than on health, which is the second-largest category. This is a subject we shall return to in a follow-on report.
© Brexit Facts4EU.Org 2025 - click to enlarge
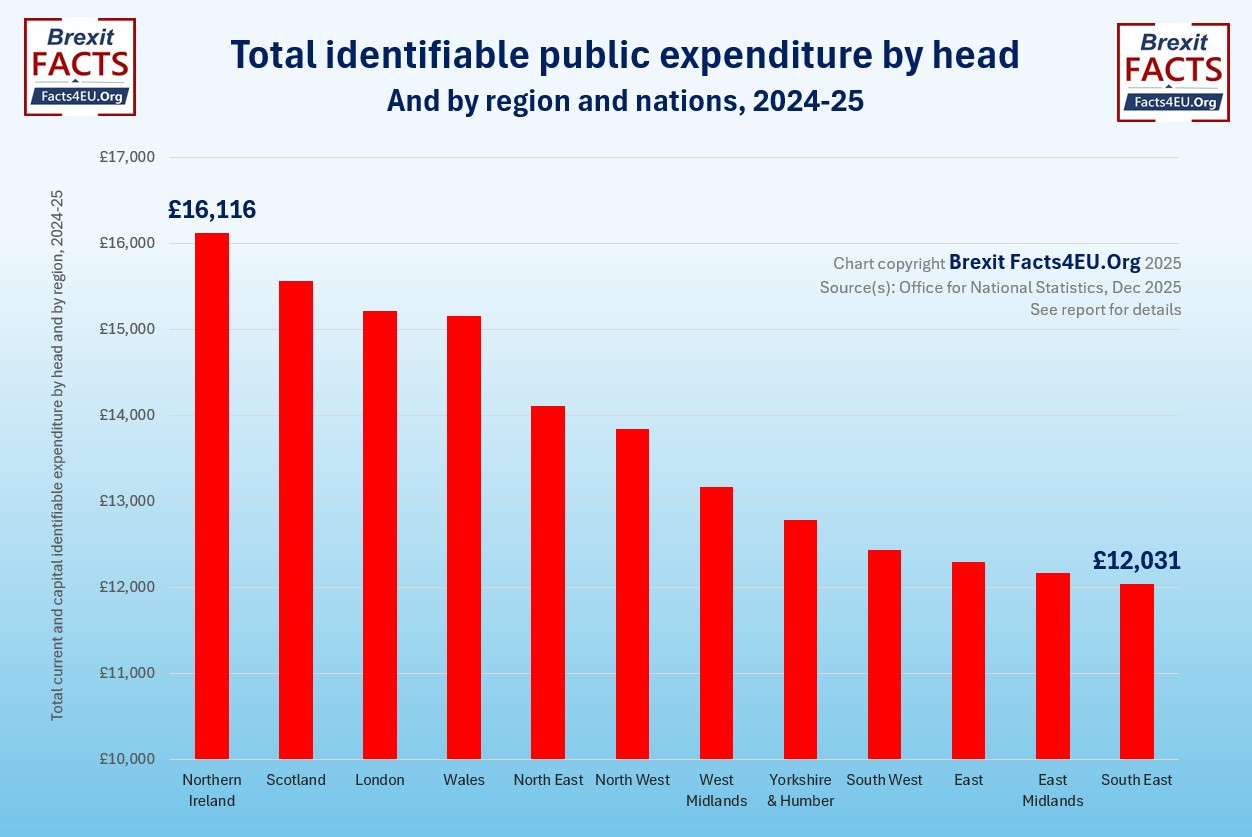
3. Where is it spent – By region and nation and by head of population
As with the areas of functional spending above, so the geographical area of spend also varies. The conventional way of showing this is by head of population. This takes account of the fact that some areas of the country are more sparsely populated than others, so it makes sense they receive comparatively less. Calculating this by head removes this imbalance.
The people of Northern Ireland come out on top. Just over £4,000 per head (+34%) more is spent in Northern Ireland than in the South-East of England.
© Brexit Facts4EU.Org 2025 - click to enlarge
The conventional answer to this difference always used to be that in Northern Ireland a significant amount had to be spent on policing and security because of the Troubles, but that is no longer true.
In fact, Facts4EU’s analysis of the detailed data from the Office for National Statistics shows that in 2024-25 only 5.2% of the total public spending in Northern Ireland was spent on policing and law and order. The proportion in the South East is 4.5%, which is close enough to make no difference overall.
When it comes to the South East, some would argue that the fact it is so crowded suggests it might need rather more public expenditure. Instead it comes bottom of the list.
We rely wholly on patriotic members of the public to survive. Please donate today if you would like to continue reading us tomorrow, next week, and the weeks after.
Any credit card user
Quick One-off

From £5 - £1,000
Monthly

From £3 per month
Paypal Users Only - Choose amount first
Quick One-off
Monthly
Don't leave this to someone else. You are that 'someone else'.
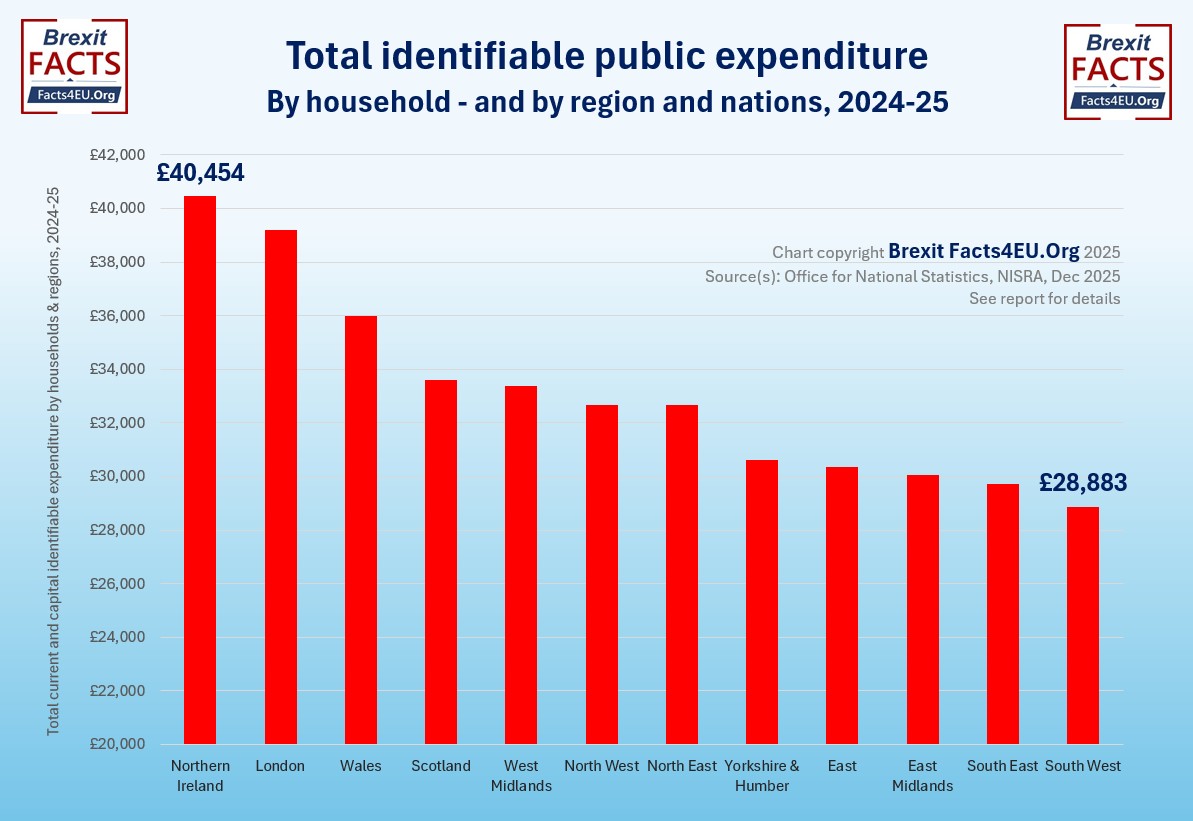
4. Exclusive – Analysis by household
Facts4EU obtained figures relating to the number and composition of households in each region of the country. Using this data we were able to calculate the amount of public expenditure which is applicable, on average, to each household in each region. The justification for this is that it reduces the impact of spreading spending across all members of the population regardless of age. In many ways it is also easier to judge public spending when it is divided between households as we are accustomed to household bills.
This produces some very interesting results, as can be seen below.
Once again, Northern Ireland comes out on top for the most public spending but this time it is the South West of England that lies at the foot of the table. In fact the difference between a household in Northern Ireland and one in the South West of England is more than £11,000 per annum.
© Brexit Facts4EU.Org 2025 - click to enlarge
5. The four nations – How England loses out in every way
With both geographical charts, the nations of Northern Ireland, Scotland and Wales do very well in comparison with the regions of England. Whether the allocation of total public spending is calculated per head of population in each, or by household, England comes at the bottom of the charts.
The nations and the English regions
It must be asked what the reason for this disparity between the English regions and the three nations of Scotland, Northern Ireland, and Wales is. Readers may wish to provide their suggestions in the comments section below.
Coming up: Which regions or nations require the most spending on benefits?
Our next report on public spending will look specifically at the area of ‘social protection’ and benefits. You do NOT want to miss this!
Observations
In the charts above we are looking at nearly £1 trillion of public expenditure which the government and its agencies are spending on our behalf, all of which is identifiable by where it is spent. No doubt it will come as no surprise to English readers to learn that England does worst out of this allocation between the nations and the regions. The big question is of course: "Why?"
We investigated who makes the decisions as to where money is spent and the answer is that it is government departments who decide this. Civil servants, in other words. The overall spending limit must be approved by Parliament in a vote but then it is down to individual departments to decide where the areas of spend they are responsible for are distributed across the United Kingdom.
Those who are doing very well out of this arrangement will be perfectly happy but English voters may wish to start asking questions of their MPs. We will be interested to read what readers have to say about this, in the comments section below.
Please, please help us to carry on our vital work in defence of independence, sovereignty, democracy and freedom by donating today. Thank you.
[ Sources: Office for National Statistics | NISRA ] Politicians and journalists can contact us for details, as ever.
Brexit Facts4EU.Org, Thurs 11 Dec 2025
Click here to go to our news headlines
Please scroll down to COMMENT on the above article.
And don't forget actually to post your message after you have previewed it!
Since before the EU Referendum, Brexit Facts4EU.Org
has been the most prolific researcher and publisher of Brexit facts in the world.
Supported by MPs, MEPs, & other groups, our work has impact.
We think facts matter. Please donate today, so that we can continue to ensure a clean Brexit is finally delivered.
Any credit card user
Quick One-off

From £5 - £1,000
Monthly

From £3 per month
Paypal Users Only - Choose amount first
Quick One-off
Monthly
Something to say about this? Scroll down for reader comments