Exclusive: How Starmer has spread out the increase in migrants across the country
Our interactive map shows almost every area has increased – use it to find yours
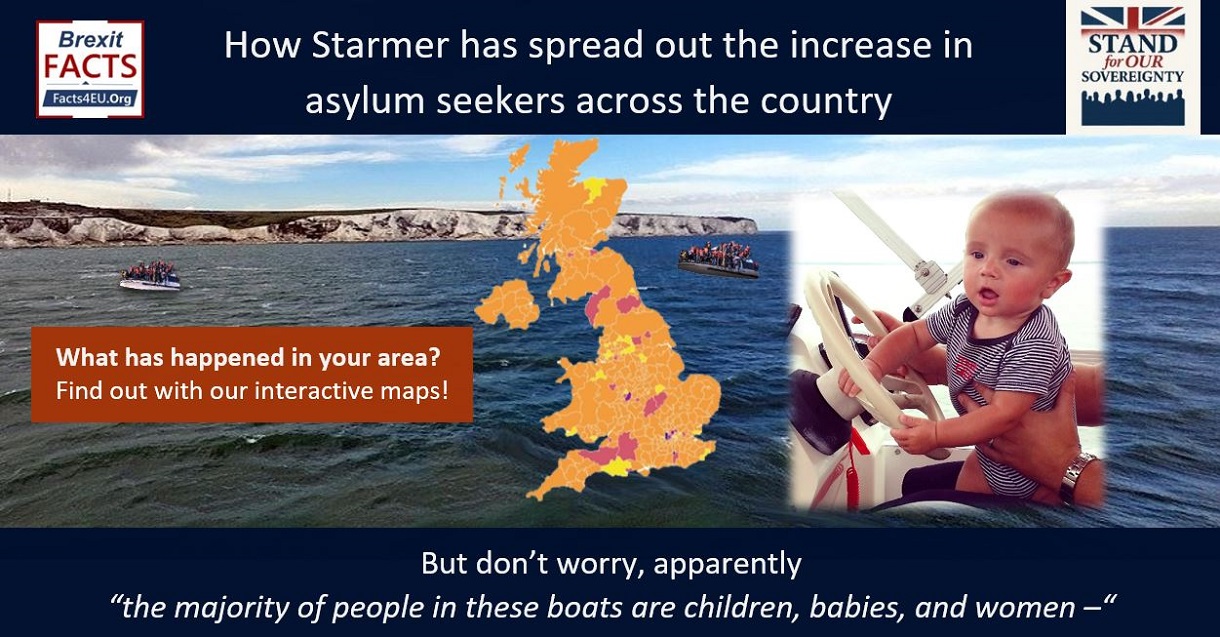
Montage © Facts4EU.Org 2025
Numbers have gone up in 91% of local authorities – Of the few where they have reduced, you won’t believe the area that has reduced the most
A special report with a famous Facts4EU ‘at-a-glance chart’ and new interactive maps
Part III of the ‘Asylum Special Report’ – a co-production with Stand for Our Sovereignty
Today we publish the next instalment in the Facts4EU and Stand for Our Sovereignty special report on asylum in the UK, particularly focusing on developments since Sir Keir Starmer came to power in the July 2024 general election, when he and his ministers promised to deal with the migrant crisis by “smashing the gangs”.
We have shared our findings from a deep dive into Home Office data with GB News online, where you will find political reaction and more.

And don’t miss the Martin Daubney Show on TV from 3-6pm today, when Martin will be presenting the information and asking the difficult questions of politicians and commentators.
This will be followed in the evening with the Farage Show at 7pm with further in-depth discussions on this report and the other news of the day
![]()
The facts on asylum in the UK – from north to south and east to west
In Part I we revealed that there were over 2,700 more migrants in hotels by March of this year since Sir Keir Starmer came to power. In Part II we exclusively proved that 87% of all boat migrants are men aged 18 years or older. We used Home Office data that would have been available to the Treasury Minister, Darren Jones, when he told the BBC Question Time audience in May:
The Rt Hon Darren Jones MP, Chief Secretary to the Treasury, BBC Question Time, May 2025
“And when you see the majority of people in these boats are children, babies, and women –”
After saying this, he refused to back down until a half-hearted acknowledgement days later admitting he may not have been quite accurate, because he had based his categorical statement on seeing just one boat.

In today’s third report in this Stand for Our Sovereignty Special Asylum report, and using the latest data we have been able to obtain from the Home Office, we look at a highly topical question.
Just how many additional migrants have been imposed on each area of the UK
since Sir Keir and his government came to power?
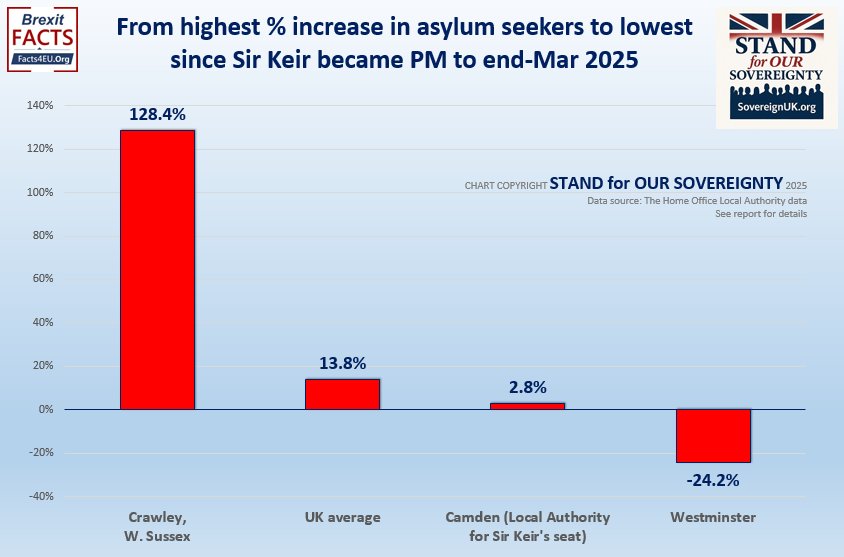
The 14% increase in migrants nationwide and the wild variations
In terms of numbers, the average local authority in the UK is now supporting (almost always with accommodation) 79 more migrants than before Sir Keir Starmer came to power. This is enough to fill two average-sized hotels. However, the average number masks some very large variations, depending on where you live.
If you live in Crawley in West Sussex, for example, your local authority is now having to support an extra 972 migrants since the general election last year. This is more than double the number inherited from before Sir Keir, amounting to an increase of 128.4% since he became PM.
The biggest winner is – would you believe? – Westminster
At the other end of the scale, there is a local authority that has seen its number of migrants fall by the largest amount. The name of that local authority is, almost unbelievably, Westminster. The home to the Houses of Parliament has seen a reduction of 391 migrants, or almost a quarter (24.2%).
[Source(s) : © User:Colin / Wikimedia Commons / CC BY-SA 4.0]
The average increase in the number of migrants being supported in each local authority since the General Election is almost 14% (13.8%).
And what about Sir Keir’s constituency?
As for Sir Keir’s own constituency, this lies in the local authority of Camden.
Since Sir Keir came to power, the number of migrants housed has increased by just 43 people, or 2.8% – around one-fifth of the average increase for the rest of the country.
The Rt Hon Suella Braverman KC MP, speaking exclusively to Stand for Our Sovereignty, Tues 19 Aug 2025
“On entering the Home Office, I realised the bill facing the taxpayer for these hotels was unacceptable. That’s why secure dedicated accommodation such as the BIbby Stockholm barge and former military sites were and still are the solution.
“As Home Secretary I worked to close over 100 migrant hotels and migrant crossings dropped by over a third. They have never been lower since I left the Home Office.
“It is a national scandal that Labour have opened our borders and accelerated the invasion of our country. The British people are rising and saying enough is enough.
“The Prime Minister has lost control of our borders and doesn’t care for the consequences.”

A very uneven distribution of extra migrants across the country
In between the two extremes of Crawley with its 128% increase and Westminster with its 24% decrease, it might be thought there would be a fairly even spread, with as many local authorities losing migrants to house as there were local authorities having to find places for extra ones. This is not the case, however. In fact the numbers look like this:-
Brexit Facts4EU.Org Summary
Local authorities – the winners and the losers, by the numbers
- Local authorities losing migrants: 26 (7%)
- Local authorities gaining migrants: 331 (91%)
- No change: 2
- Undeclared: 5
© Brexit Facts4EU.Org 2025 - click to enlarge
[Source(s) : Home Office]
An astonishing 91% of local authorities have seen their obligations rise, whereas only 7% have seen numbers fall. Not only have numbers risen, but the increase has been distributed unevenly aross the United Kingdom. (See below.)
Richard Tice MP, Deputy Leader, Reform UK, speaking exclusively to Stand for Our Sovereignty, Tues 19 Aug 2025
“Stand for Our Sovereignty’s latest asylum report for GB News really brings home just how invasive this crisis has become. It’s affecting us all, right across the UK, as we can see from this excellent research which drills down to every local authority in the country.
“The impact on our economy keeps on growing as the numbers keep on rising. We’re spending more and more on this problem when the money is badly needed in providing the kind of local services which people have the right to expect – on hospitals, doctors’ surgeries, schools, even the state of the roads. Instead it’s going on hotels for groups of mostly young men from other countries. I’m not surprised at the number of local protests which have been springing up from people who weren’t consulted and who are quite naturally alarmed at the potential risks these centres pose.
“This government shows no signs of ever getting this under control because they simply will not take the tough decisions required. They should move aside for those who can.”

The big question for readers is: What has happened in your area?
Thanks to a deep dive through the hundreds of Home Office spreadsheets, the Facts4EU and Stand for Our Sovereignty teams have been able to analyse a variety of data and trends involved in the whole asylum debate. In the case of the housing of migrants, we have calculated the number of additional migrants now supported by every single one of the 364 local authorities in the United Kingdom since Sir Keir came to power, and have translated the results into two interactive maps.
The first shows the percentage increase in migrants in each area since the General Election last year. The second shows the additional actual number involved. Detailed instructions follow the maps, to enable readers to see what has been happening in their own area.
Please help us to keep going with a donation today. We rely wholly on patriotic members of the public to survive. And/or, please consider joining Stand for our Sovereignty. The more Members they have, the louder their voice in Westminster!
Any credit card user
Quick One-off

From £5 - £1,000
Monthly

From £3 per month
Paypal Users Only - Choose amount first
Quick One-off
Monthly
Don't leave this to someone else. You are that 'someone else'.
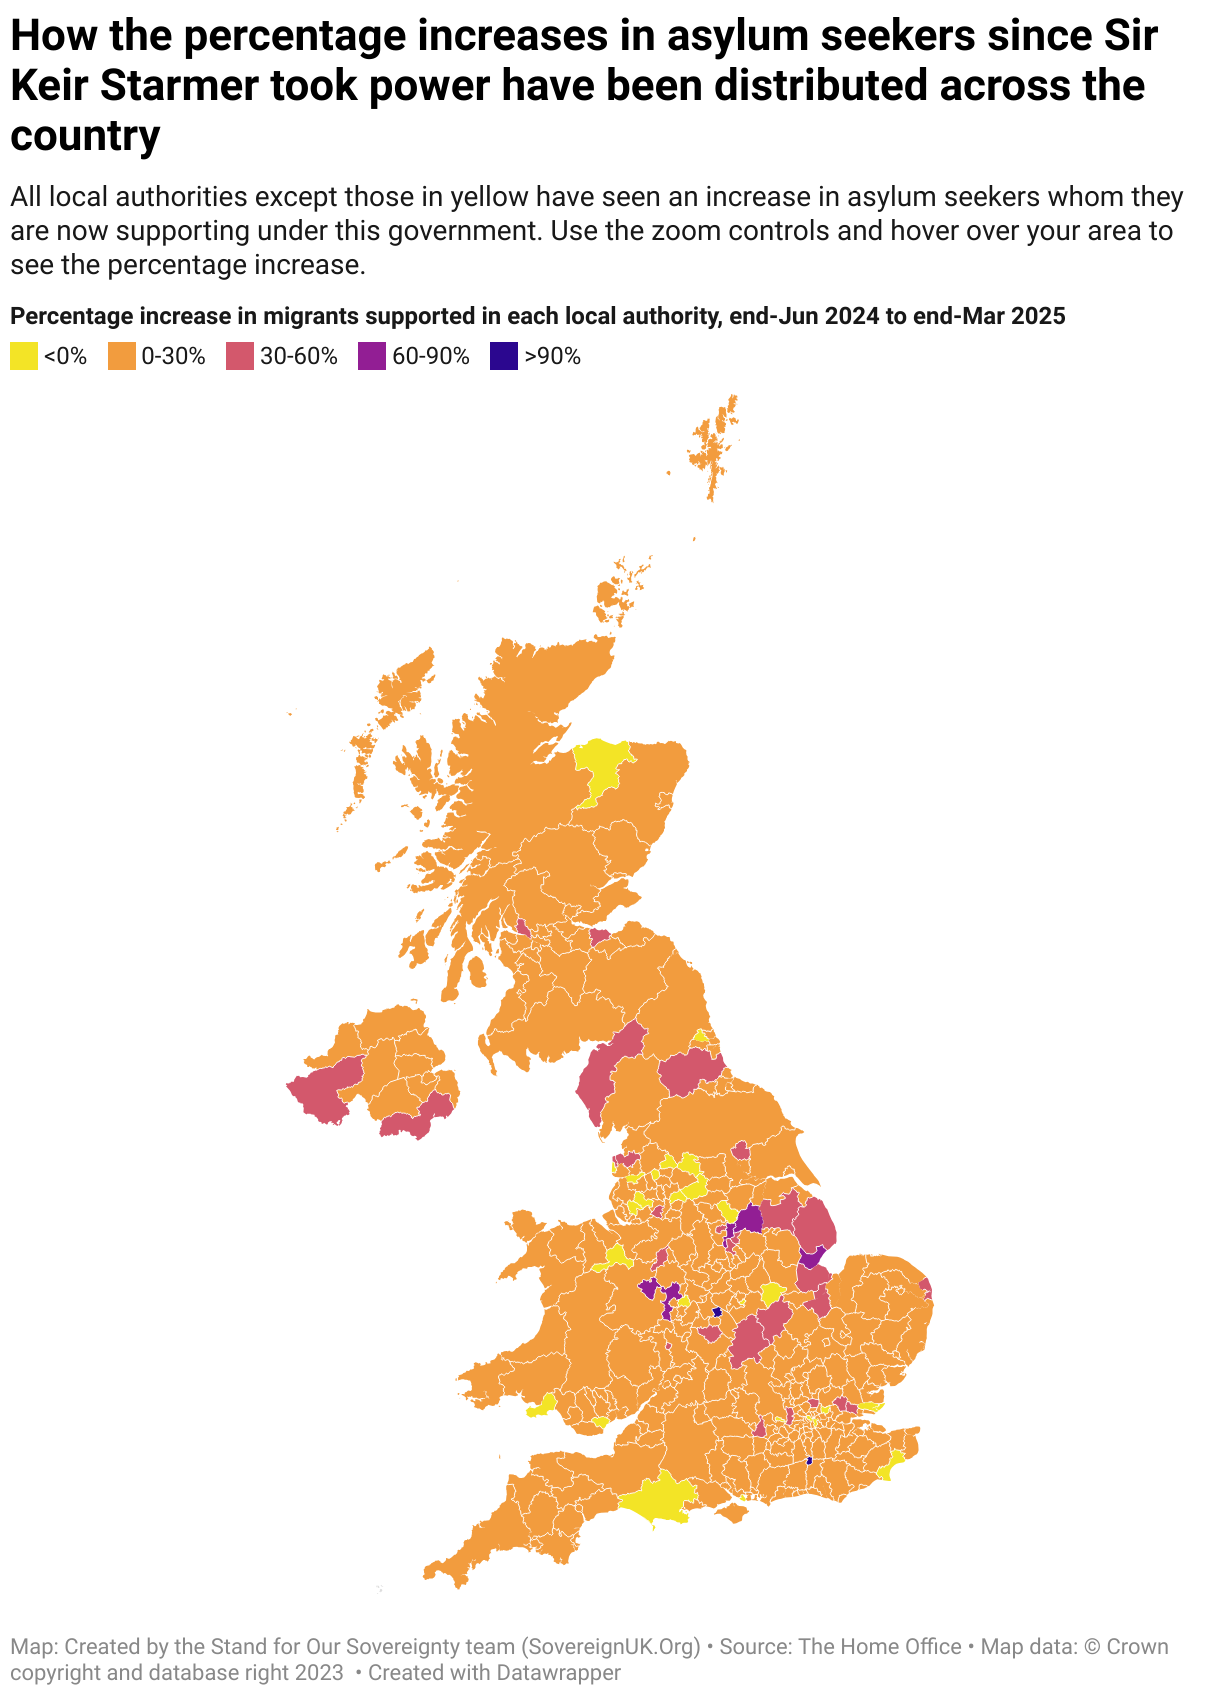
MAP 1 – Percentage increase in each area
Please note that the titles of the maps technically should refer to 'migrants' rather than 'asylum seekers', as some include those who have not applied for asylum but who are nevertheless part of the three groupings in the Home Office's official totals.
MAP 2 – Increase in actual numbers of migrants in each area
IMPORTANT: At first sight these two maps may look almost the same but there are some big differences when readers zoom in. Map 1 is useful for comparing how one area has done compared to another. Map 2 gives readers the actual numbers of additional migrants their local authority is having to support. This gives a better idea of the amount of accommodation each local authority has had to find.
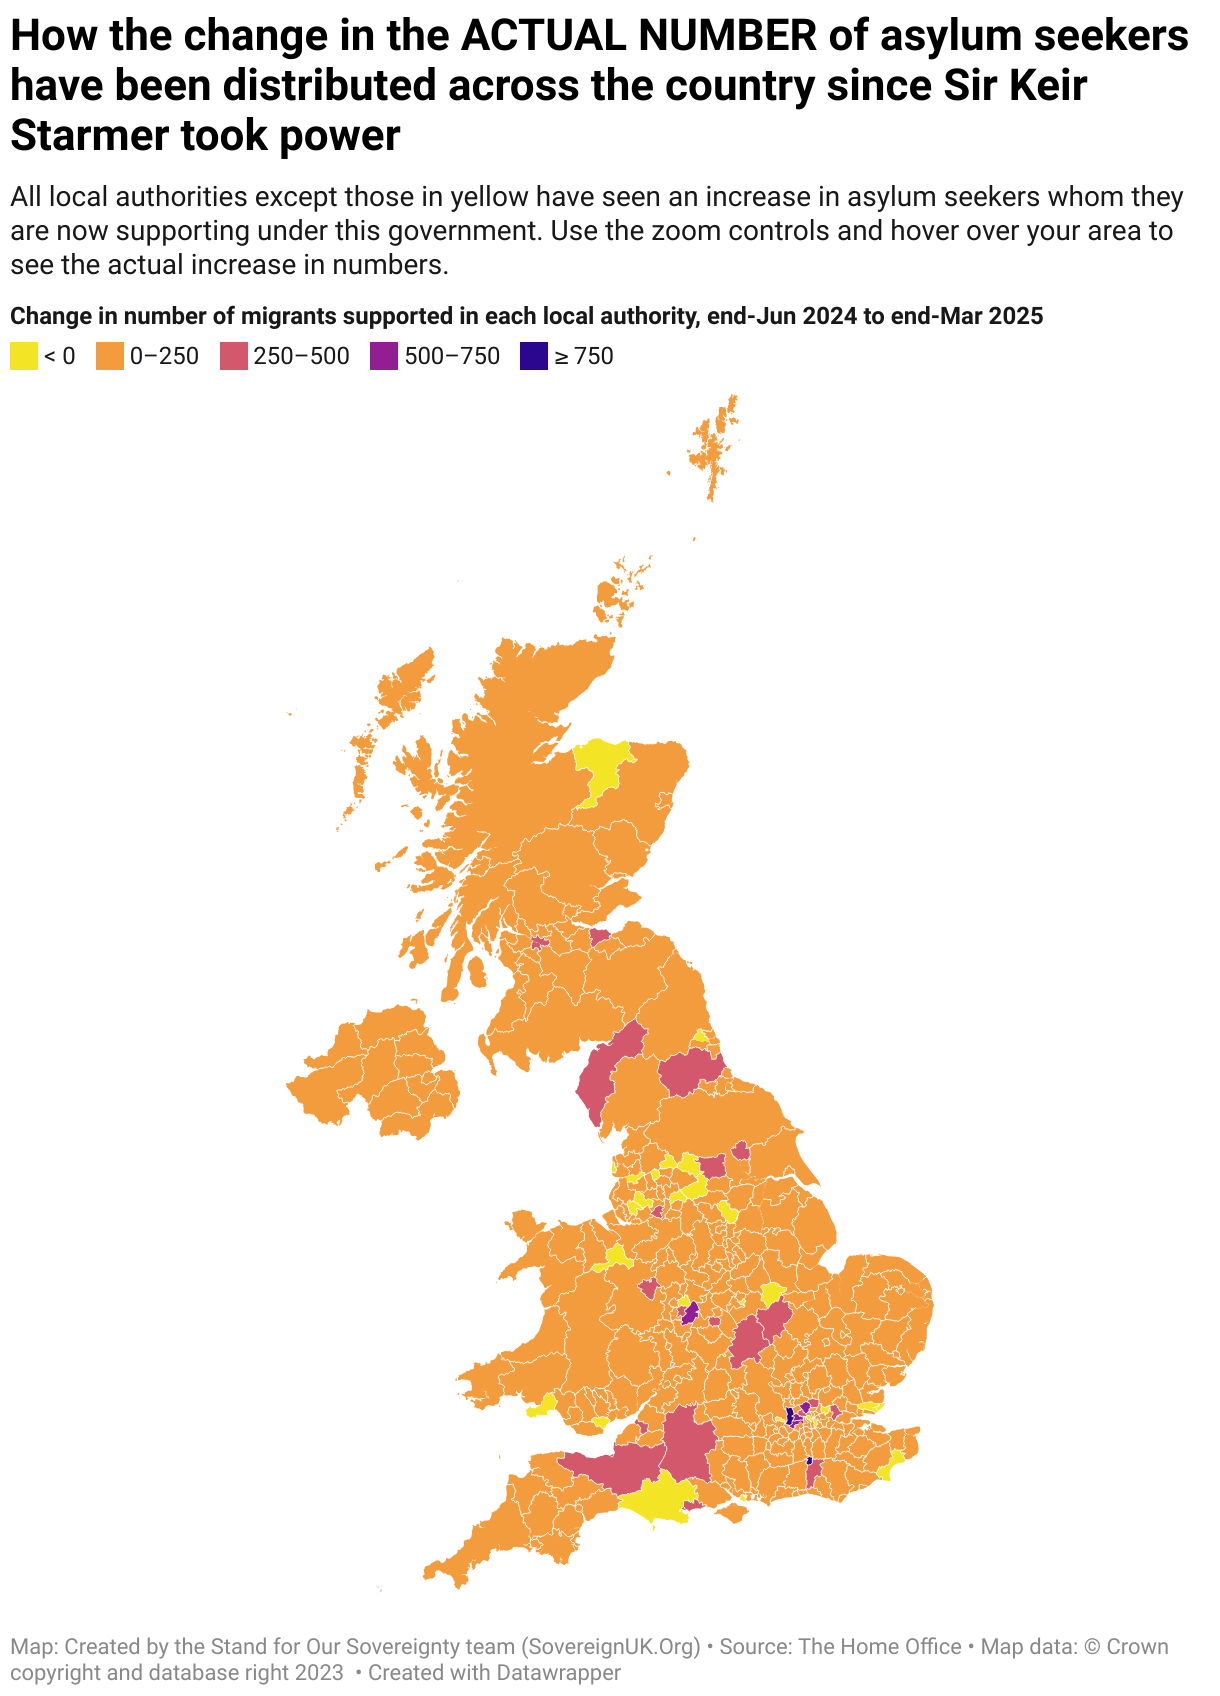
What the colours mean
The colour palette with its corresponding percentages is shown at the top of each map. It ranges from light yellow (small decreases) through shades of burnt orange to purple to dark purple/blue (the highest increases). As can be seen, the vast majority of the country is at least burnt orange, indicating an increase.
It should be noted that these increases only run up to the end of March, covering the first nine months of the current government. These increases are likely to be significantly higher now, particularly with the large increase in the number of boat migrants in recent months and the use of even larger boats, but we have used the latest information on how these have been distributed that we could obtain from the Home Office’s innumerable spreadsheets.
How to use these maps to find what you want
- The first map shows percentage increases (or in some cases decreases) in the number of migrants being supported by the local authority since Sir Keir came to power. Almost always this means accommodation as well as all the other support services. In some instances migrants have chosen only to be in receipt of money.
- The second map shows the same information, but expressed as the number of extra migrants rather than the percentage change.
- We have shown both maps because local authorities vary in the size of populations they cover.
- To find the figures for where you live – whether percentages or actual numbers – simply click on the map and drag it so that your area is roughly in the middle, or as close as you can get. Then use the ‘+’ button in the top right of the map to zoom in. Then hover over your local authority area and a box will pop up with the information.
- Local authorities gaining migrants: 331 (91%)
Even the mainstream newspapers are now asking if Britain is a tinderbox
We have seen a growing number of local, peaceful protests about buildings suddenly being used to house the new migrants covered in this report. The most high profile was probably in Epping, but there have been many more.
Another which hit the headlines recently was in Waterlooville, whose constituency MP is former Home Secretary the Rt Hon Suella Braverman KC MP.
It’s not racist to want to protect our towns and our families.
— Suella Braverman MP (@SuellaBraverman) August 14, 2025
It’s not racist to love our country.
It’s not racist to say: enough is enough.
My speech to the patriots of Waterlooville yesterday 👇 pic.twitter.com/WyPNcOFHiw
According to our map above, Havant (the local authority for Waterlooville) saw a 26.6% increase in the number of migrants it had to support in the year to end-Mar 2025. This is nearly double the national average and almost 10 times the increase the Prime Minister has seen in his own constituency.
This equates to 53 individuals. In the high street the authority were going to house 35. It must also be remembered that we have witnessed a dramatic upsurge in the number of illegal migrants crossing in small boats, as reported on so comprehensively by the GB News Home and Security Editor, Mark White. It is very likely that the new figure for Havant will be much higher when the data is updated.
COMING UP….
We are currently working through some very interesting information we have uncovered which we believe will confirm many people’s suspicions on some important matters. Having suspicions is one thing, or course, but one of our jobs is to provide the hard evidence. We strongly suggest you will not want to miss the next report in this Facts4EU and Stand for Our Sovereignty Asylum Special !
Observations
Today’s report in the Facts4EU and Stand for Our Sovereignty ‘Asylum Special’, prepared for GB News, takes some of the very large numbers we hear about on a daily basis, of the numbers of unknown individuals entering our country illegally each day, and brings these much closer to home.
To be a sovereign nation, control over who can come in is one of the fundamentals. For many years now it has been obvious that we do not have this. This is not merely a theoretical notion – it affects people’s quality of life and the opportunities they might feel they have the right to expect as citizens of one of the richest and most-developed countries in the World. Specifically it is impacting housing opportunities – particularly for the young – as well as everyone’s ability to see a doctor or to benefit from any number of other local and national services.
In addition to this there is the very serious concern that we simply don’t know who the majority of these illegal migrants really are. Given the countries they say they are originally from this presents a potent security risk.
We are now reading articles in the mainstream media referring to Britain being like ‘a tinderbox’ and other very troubling expressions. All over the country ordinary people have had enough. When Stand for Our Sovereignty started, it began by saying that “Enough is enough”, and that slogan is still on their homepage. Last week we noticed a video on Suella Braverman’s Facebook channel where she is addressing the crowd in Waterlooville and leading the people present with this chant. We are very content that the Stand for Our Sovereignty slogan is being used and we would add that we very much hope all protests will continue to be peaceful and yet powerful.
Please, please help us to carry on our vital work in defence of independence, sovereignty, democracy and freedom by donating today. Thank you.
[ Sources: The Home Office ] Politicians and journalists can contact us for details, as ever.
Brexit Facts4EU.Org, Wed 20 Aug 2025
Click here to go to our news headlines
Please scroll down to COMMENT on the above article.
And don't forget actually to post your message after you have previewed it!
Since before the EU Referendum, Brexit Facts4EU.Org
has been the most prolific researcher and publisher of Brexit facts in the world.
Supported by MPs, MEPs, & other groups, our work has impact.
We think facts matter. Please donate today, so that we can continue to ensure a clean Brexit is finally delivered.
Any credit card user
Quick One-off

From £5 - £1,000
Monthly

From £3 per month
Paypal Users Only - Choose amount first
Quick One-off
Monthly
Something to say about this? Scroll down for reader comments