Q: How much did mortality increase last (Covid) year compared to 30 year average? A: 0.03%
You were more likely to die in 14 out of the previous 30 years
© Facts4EU.Org 2021
Last year your chance of dying rose by only 0.03% compared to the 30 year average
An exceptional Facts4EU.Org research report
into mortality and the Covid effect
Important: Of necessity, we have used the total mortality rate figures available - these do not reflect the disproportionately high impact of Covid-19 on the elderly and those with serious pre-existing health conditions.
In the last year our society, way of life, individual freedoms, and economy have been subjected to their most serious damage in 100 years. As usual, Facts4EU.Org therefore felt it important to get some perspective, by looking at a basic measure which readers might wish to know.
What follows is factual, it uses the latest official Government statistics, and has never been reported elsewhere.
Our question was simple: How much did mortality increase last year, historically, as a result of Covid?
Brexit Facts4EU.Org Summary
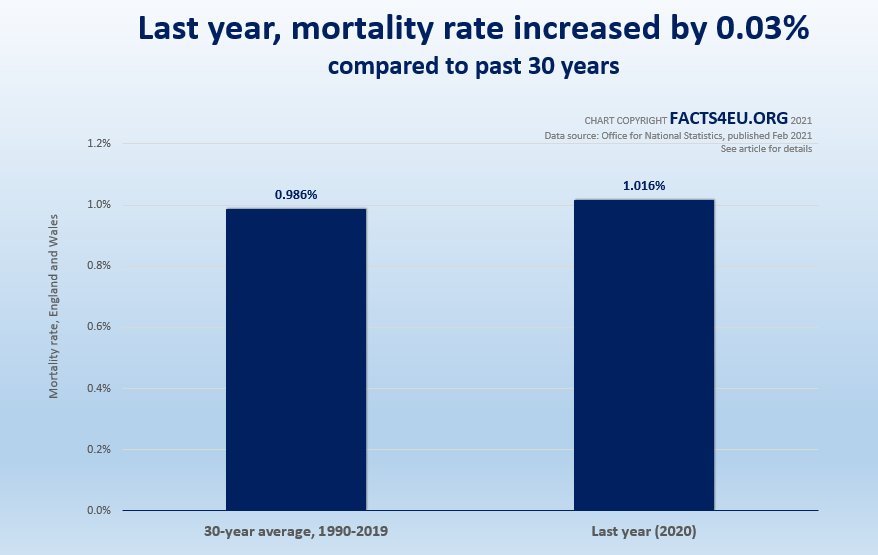
Mortality rates in England and Wales, 1990-2020
Based on the number of deaths per 100,000 in the population, expressed as a percentage
- 30 year average, 1990-2019 : 0.986% (around one in 100)
- 2020 (first Covid year) : 1.016% (around one in 100)
- Difference in chance of dying : 0.03%
[Source: Annual deaths data from the Office for National Statistics, published Feb 2021]
© Brexit Facts4EU.Org - click to enlarge
Why are deaths as a proportion of population important?
The population of England and Wales has increased by an astonishing 18.3% since 1990 – and these are only the official statistics. We have always believed that the population has increased far more, which is also the view of major supermarkets who should know based on food consumption.
This is also backed up by the HMRC’s data for new National Insurance registrations, which far outstrips the official immigration data as we have previously reported.
Facts4EU.Org has consistently argued that all statistics like this relating to the UK should take into account population growth – official and unofficial. Only then can the public see information in a proportionate way.
How many more people died last year, compared to previous years?
There was of course an increase in deaths in England and Wales in 2020, compared to 2019. The extra deaths amounted to 77,161. Comparing 2020 with 2018 the difference was less, at 66,413. Comparing 2020 with the previous 30 years must also, naturally, come with a 'health warning'. There have been significant advances in medicine in that time. This said, these advances have tended to improve quality and duration of life, but have not stopped people dying.
Two problems arise when we are told that “135,000 people in the UK have died of Covid-19”. Firstly, there are now strong questions being raised about the number of people who died from Covid-19 as the underlying cause of death, rather than dying of another cause but who also tested positive for Covid. The ONS itself is now suddenly showing a massive difference between those dying “due to Covid” compared to “with Covid”, In the last five weeks this gap has widened from around 12% previously, to around 23% now. We have not been able to find an explanation for this.
Secondly, the figures generally quoted are not annual figures, which makes comparisons for ordinary people very difficult.
In fact, the ONS now say that 73,444 people died in England and Wales “due to Covid” last year (2020). This a terrible number, but it’s not 135,000 and it must be set against the total number of 608,002 deaths in England and Wales in 2020 from all causes.
The average daily deaths in the five years from 2015 to 2019 was 1458 per day, from all causes. The top five killers were dementia/Alzeimers, heart disease/attacks, respiratory disease, cerebrovascular diseases, and trachea/lung cancer.
Finally, why did we only quote the figures for England and Wales?
The answer is simple. The ONS quotes statistics like these for England and Wales. They advise readers to go to the Scottish and Northern Irish statistics agencies for their figures. We simply don't have the funding to do this. Tracking down figures which are fully comparable is not as easy as it sounds. We hope that Scottish and Northern Irish readers will forgive us, but we suspect the numbers would not change significantly.
Observations
When it comes to articles like this about Covid we are severely restricted in what we can say, as a result of the inhibition on everyone from saying anything which might be seen as contravening the orthodox, approved line. This restriction on freedom of speech is something we find deplorable and we are fighting it tooth and nail.
For now, we must let the facts above speak for themselves. These are the official facts, sourced from the Office for National Statistics and analysed by Facts4EU.Org. You just haven’t seen or heard them anywhere else.
It is up to readers to draw their own conclusions about the impact on the mortality rate last year, compared to the average of the last 30 years. Tragically, Covid-19 has almost completely affected the elderly and those with pre-existing conditions, and there are some serious questions to be asked about care homes, for example.
The key fact is this: For the population of England and Wales as a whole, the mortality rate increased by 0.03% compared to the average of the previous 30 years.
We hope that the above information, researched from official sources, has been helpful.
Where would we be without you, our readers?
We are most grateful to readers who have donated so far this year, but we badly need more readers to do the same if we are to continue in our sixth year - researching facts, scrutinising, publishing, and lobbying MPs. Quick, secure, and confidential donation links are below this article, or you can use our Donations page here. 10 readers donating £500 per month, or 50 readers donating £100 per month, or 1000 readers donating £5 per month - on top of the one-off donations and monthly donations we currently receive, this would just about keep us going. If you have never donated before, please, please, keep us going with a donation now. Thank you so much. You will receive a personal 'thank you' email from a member of the team, but you will not be badgered by us for more funds, unlike some organisations!
[ Sources: Office for National Statistics ] Politicians and journalists can contact us for details, as ever.
Brexit Facts4EU.Org, Thur 15 Apr 2021
Click here to go to our news headlines
Please scroll down to COMMENT on the above article.
And don't forget to actually post your message after you have previewed it!
Since before the EU Referendum, Brexit Facts4EU.Org
has been the most prolific researcher and publisher of Brexit facts in the world.
Supported by MPs, MEPs, & other groups, our work has impact.
We think facts matter. Please donate today, so that we can continue to ensure a clean Brexit is finally delivered.
Any credit card user
Quick One-off

From £5 - £1,000
Monthly

From £3 per month
Paypal Users Only - Choose amount first
Quick One-off
Monthly
Something to say about this? Scroll down for reader comments